
Intro
This will be a series showing you each step in developing a portfolio tracker on Google Sheet. We’ll start by building a tracker that tracks the p/l of your current stock positions and the p/l of your closed positions. As the project progresses, we’ll develop more advanced functions, some of which you can see from the roadmap below. If you’re a retail investor who’s just starting to learn about investing, I’m sure you can find the process of building your own tracker worthwhile!
| # | Description |
|---|---|
| 1 | Calculation of unrealized & realized p/l |
| 2 | Showing position size |
| 3 | Calculation of p/l for short positions |
| 4 | Support for multiple asset class types and currencies |
| 5 | Support for multiple accounts |
| 6 | Dividend entry |
| 7 | Account cashflow tracking |
| 8 | Portfolio analysis |
| 9 | Performance metrics |
| 10 | Options support |
Please note that historical FX rates will not be used because the focus of the portfolio tracker is on the p/l of open positions.
Minimum Viable Tracker
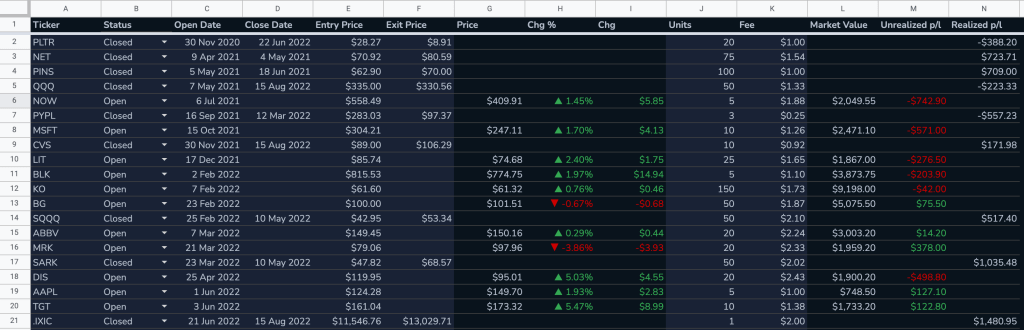
The most basic information the Google Sheet needs to calculate the p/l of your holdings include the ticker, the entry price, the number of units and the current price of the stock. However, we’d also like to include other parameters such as open date, close date, exit price, and status (i.e. whether the position is open or closed) so the tracker can also track the p/l of closed positions later down the road. In my example, these parameters are laid out as such.
| A | B | C | D | E | F | G | H | I |
| Ticker | Status | Open Date | Close Date | Entry Price | Exit Price | Price | Units | Unrealized p/l |
The only two columns that require a formula are column G and I. Since the rest of the columns require manual input, it’d be a good habit to highlight them in a different color so the user of the sheet will not accidentally overwrite cells with formulas. Also, I’d freeze the header row so when you have more rows filled than the screen can show, the header row will still be showing on top.
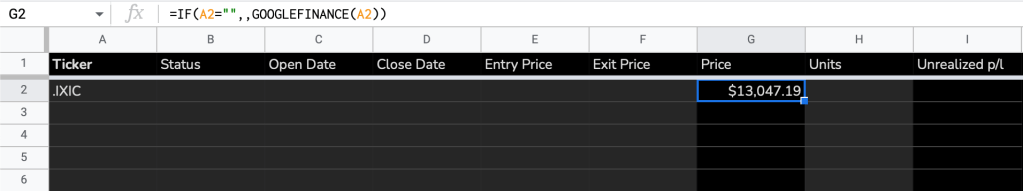
The formula for getting the stock price cannot be simpler, simply type the following formula in cell G2.
=GOOGLEFINANCE(A2)This tells Google Sheet to fetch the stock price* from cell A2, the cell for typing in the ticker. But since cell A2 is still blank, your formula will return an error. Let’s expand the formula so that it returns the stock price ONLY if cell A2 is not blank.
=IF(A2=“",,GOOGLEFINANCE(A2))*Please note that there may be a delay in stock quotes provided by Google because it is a free service after all, for details, please see this link.
Now it’s time to type a ticker to test the formula. I used “.IXIC”, the ticker identified by Google as the Nasdaq Composite index. And voilà!
Then, we’ll continue with our Nasdaq example by adding an open date, an entry price and the number of units on column C, E and H respectively. This gives the sheet enough information to calculate the unrealized p/l. The way unrealized p/l is calculated is as follows:
Unrealized p/l = ( current stock price – entry price ) * number of units
Therefore, in cell I2, type in the following
=(G2-E2)*H2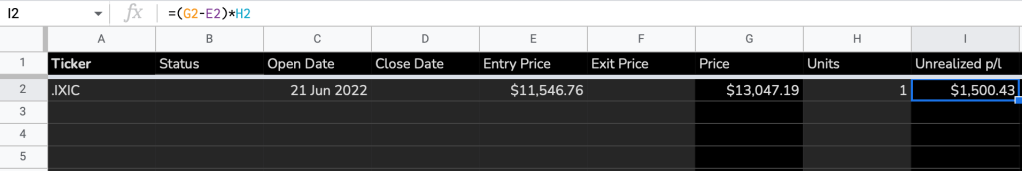
To make the formula in cell I2 work across rows, you can copy the formula down the rows by selecting cell with the formula (G2) and dragging the corner of the cell to the bottom of the sheet. However, I prefer to use ARRAYFORMULA. With ARRAYFORMULA, you only need to type the formula into a header cell and the formula will be applied to the rest of the column. This is a great tool when you’re handling big datasets.
A quick way to turn a regular formula into an array would be to use the shortcut Ctrl+Shift+Enter for PC / ⌘ + Shift + Enter for Mac. Then, specify the area you want the formula to apply to. In this case, we want the formula to be filled all the way to the bottom of the sheet, therefore, change G2 to G2:G, E2 to E2:E etc..
=ArrayFormula((G2:G-E2:E)*H2:H)Currently, our formula lives in cell I2. However, when you work with a big dataset, you probably need to use the filter function for various purposes. In this case, we cannot have the ARRAYFORMULA reside in a cell that might change position easily. Therefore, we should move the formula to the header row instead. First, delete the formula in cell I2, and in cell I1, type the following:
={"Unrealized p/l”;ArrayFormula((G2:G-E2:E)*H2:H)}Curly brackets are used in Google Sheet to create arrays, whereas semicolons are used to delimit rows. By typing the formula above, you’re basically telling Google Sheet to put the words “Unrealized p/l” in cell I1 and put the ARRAYFORMULA in cell I2. This way, using filters are not going to break anything because your formula now resides in the header row.
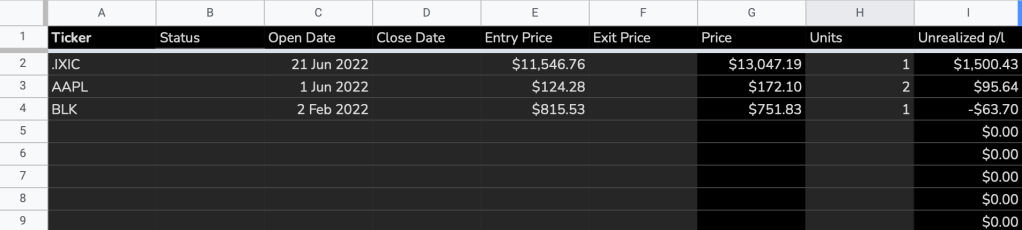
However, we’re not finished with the formula yet. Since all the rows without a ticker will return “$0”, let’s add an IF function so only rows that have a ticker entered return a result.
={"Unrealized p/l";ArrayFormula(IF(A2:A="",,(G2:G-E2:E)*H2:H))}Since the GOOGLEFINANCE function is not compatible with ARRAYFORMULA, we need to use the BYROW function in conjunction with LAMBDA in order to replicate the result of an array. (Read more about the functions here.) As per our usual practice, we’ll hide the formula in the header row:
={"Price";ArrayFormula(IF(A2:A="","",IF(B2:B="Open",BYROW(A2:A,LAMBDA(ticker,GOOGLEFINANCE(ticker))),)))}
This tells Google Sheet that if a ticker is entered and the Status is “Open”, fetch the price of the stock. In other conditions, return a blank cell.
At this point, I’ll fill it with a few more stock positions because later on, we’ll add the capability to calculate closed stock positions.
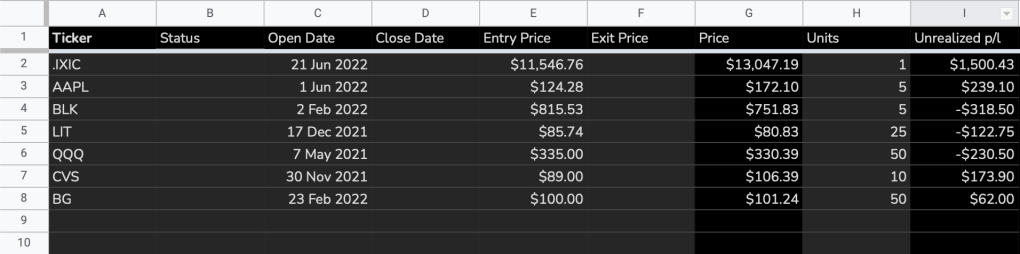
There you have it, a basic portfolio tracker for your stocks!
To be continued.
Save yourself the trouble of making a portfolio tracker from scratch by using the ZestFi Stock Portfolio Tracker. Not your typical Google Sheet template, the ZestFi Stock Portfolio Tracker lets you easily track all your stocks even if you have multiple accounts, own different types of assets, and hold multiple currencies! This tracker makes use of the GOOGLEFINANCE API to fetch stock price updates and provides powerful analytics presented in a ultra clean dashboard, helping you make the best investment decisions. Say goodbye to the hassle of going back and forth between different apps and website to manage your investments, and say hello to ZestFi!
