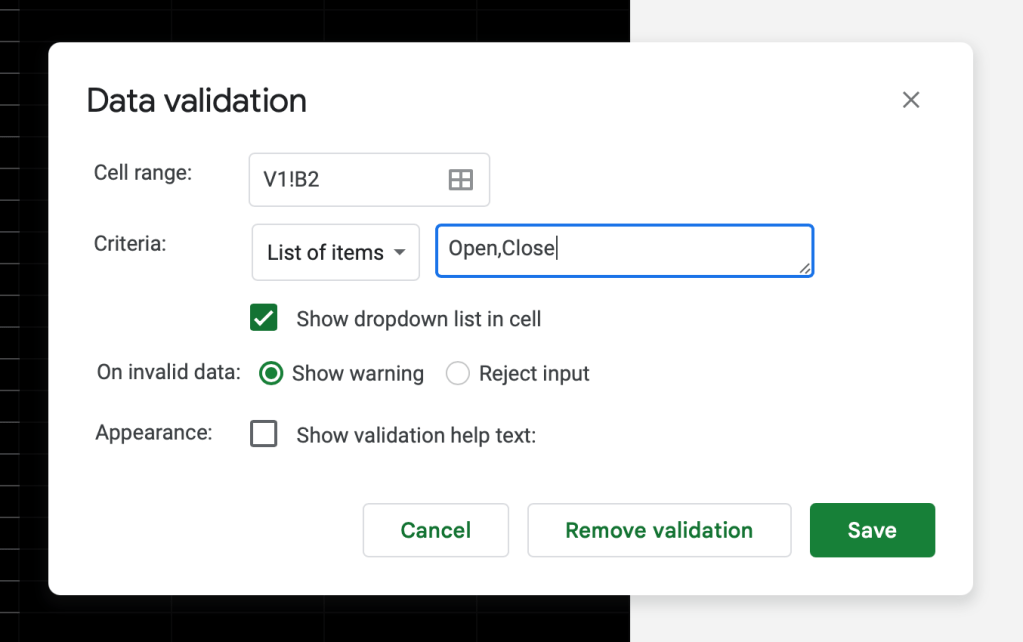
We’ll now get to the columns that we’ve left blank from our previous tutorial. First, let’s select cell B2, then in the menu above, go to “Data” > “Data validation”. Under “Criteria”, select “List of items”, and type “Open,Close” in the box next to it. This creates a dropdown menu in cell B2 consisting of two options, i.e. “Open” and “Close”. Then, copy the dropdown menu to all cells in the same column using the fill down method described in the last tutorial. Now, you can mark all current positions as “Open”.

From a portfolio management perspective, it would be helpful if the tracker isn’t just showing the amount of p/l for each position but also the size of each position in the portfolio. To do that, let’s add one column showing the market value of an open position. The market value of a position is calculated as follows:
Market value = current stock price * number of units
Therefore, we’ll insert one column before I and rename the blank column “Market Value”. Then, in cell I1, type in this formula:
=G2*H2Continuing with our usual practice, we’ll turn this into an ArrayFormula and place it in the header. The resulting formula to be placed in cell I1 will look like this:
={"Market Value";ArrayFormula(IF(A2:A="",,G2:G*H2:H))}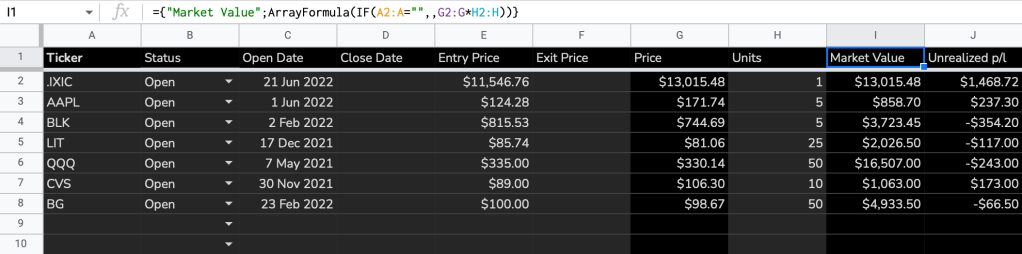
Then, we’ll use column K as the column showing the realized p/l of a position. The calculation is as follows. We’ll also insert a column before I and rename if “Fee” as the broker fee also needs to be included in the p/l calculation.
Realized p/l = (exit price – entry price) * number of units – fee
With the consideration that the realized p/l should only be displayed when a position is closed, the formula in cell L2 should look like this:
=IF(B2=“Closed",(F2-E2)*H2-I2,"")After the ArrayFormula treatment, the formula to be placed in cell L2 would be:
={"Realized p/l”;ArrayFormula(IF(B2:B="Closed",(F2:F-E2:E)*H2:H-I2:I,""))}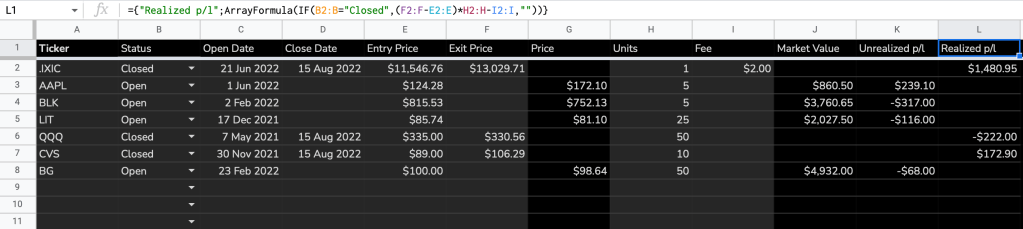
There is also no need for the unrealized p/l to display when a position is closed, so we’ll expand the formula in cell K1 as such:
={"Unrealized p/l”;ArrayFormula(IF(A2:A="",,IF(B2:B="Closed",,(G2:G-E2:E)*H2:H)))}Lastly, the market value should also be blank when a position is closed, hence in cell J2, we’ll expand the formula as such:
={"Market Value”;ArrayFormula(IF(A2:A="",,IF(B2:B="Closed",,G2:G*H2:H)))}Now that we have completed the core functionalities of the tracker i.e. tracking realized and unrealized p/l, let’s add two more columns showing the price change and the % price change. These might provide some context for your investment decisions.
Insert 2 columns after Column G, in H2, we’ll fetch the % change of the stock price since the previous day’s close by typing in this formula:
=IF(A2="","",IF(B2="Open",GOOGLEFINANCE(A2,"changepct"),))To turn this into an array, we’ll use the BYROW function with LAMBDA again, since GOOGLEFINANCE isn’t compatible with ARRAYFORMULA.
={"Chg %";ArrayFormula(IF(A2:A="","",IF(B2:B="Open",BYROW(A2:A,LAMBDA(ticker,GOOGLEFINANCE(ticker,"changepct")/100)),)))}Then, in Column H, we’ll fetch the price change of the stock since the previous day’s close using this formula:
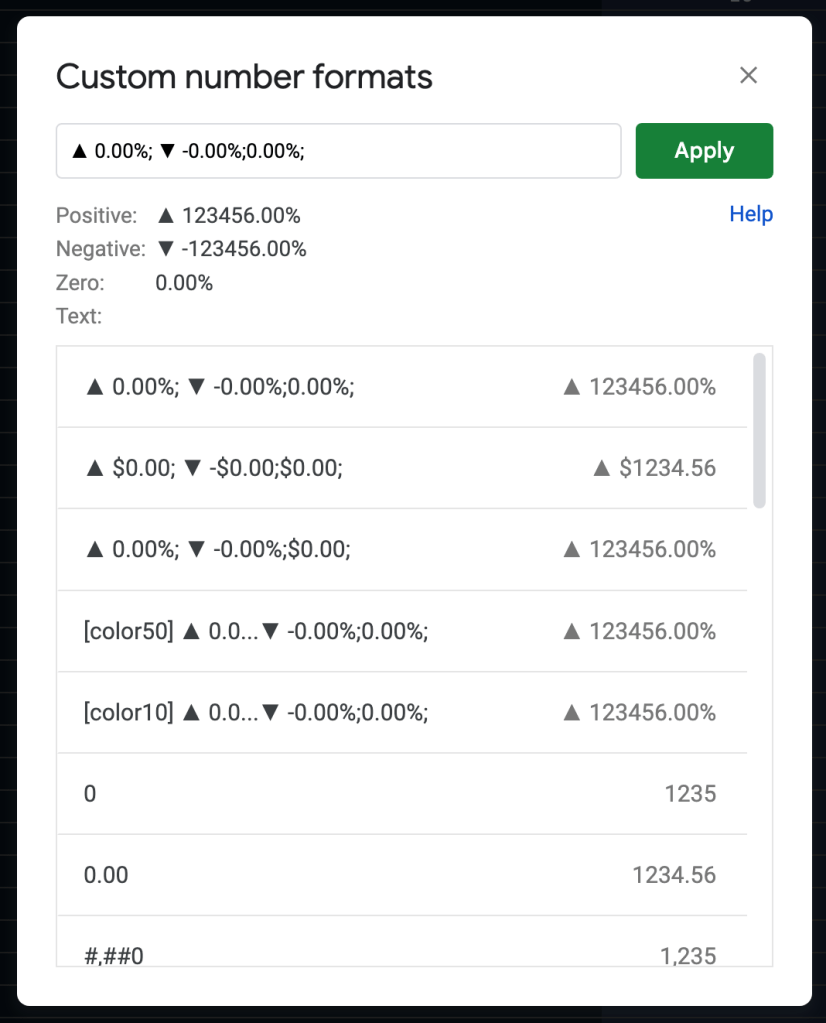
={"Chg";ArrayFormula(IF(A2:A="","",IF(B2:B="Open",BYROW(A2:A,LAMBDA(ticker,GOOGLEFINANCE(ticker,"change"))),)))}To make the price changes more visually striking, we’ll add “▲” before the % value if it’s positive, and “▼” if it’s negative. Go to “Format” > “Number” > “Custom number format”, and enter the following. The last “0.00%” tells Google Sheet to show two decimal places for the percentage value.
▲ 0.00%; ▼ -0.00%;0.00%;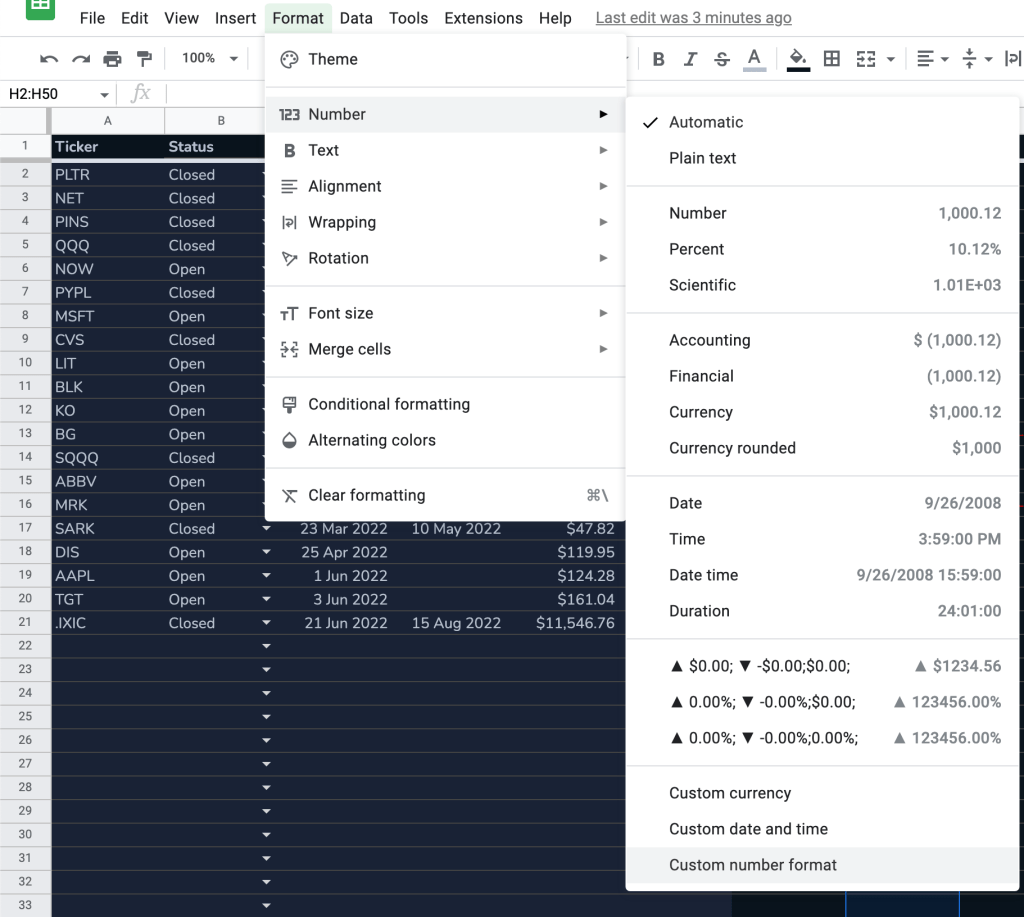
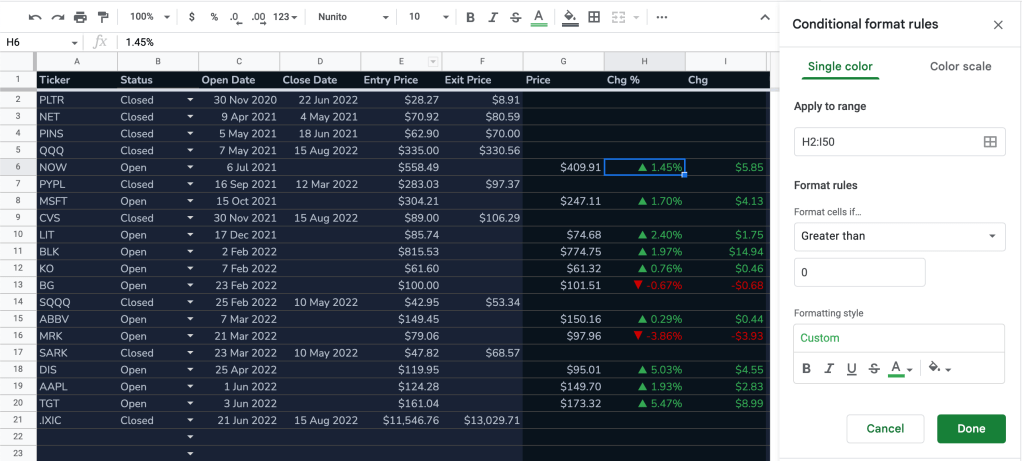
Finally, we’ll use conditional formatting to give the positive and negative values green and red colors respectively. Go to “Format” > “Conditional Formatting” and set the colors. Apply the same to the Unrealized p/l column.

This concludes part 2 of the series. Stay tuned for part 3 and beyond!
Save yourself the trouble of making a portfolio tracker from scratch by using the ZestFi Stock Portfolio Tracker. Not your typical Google Sheet template, the ZestFi Stock Portfolio Tracker lets you easily track all your stocks even if you have multiple accounts, own different types of assets, and hold multiple currencies! This tracker makes use of the GOOGLEFINANCE API to fetch stock price updates and provides powerful analytics presented in a ultra clean dashboard, helping you make the best investment decisions. Say goodbye to the hassle of going back and forth between different apps and website to manage your investments, and say hello to ZestFi!
