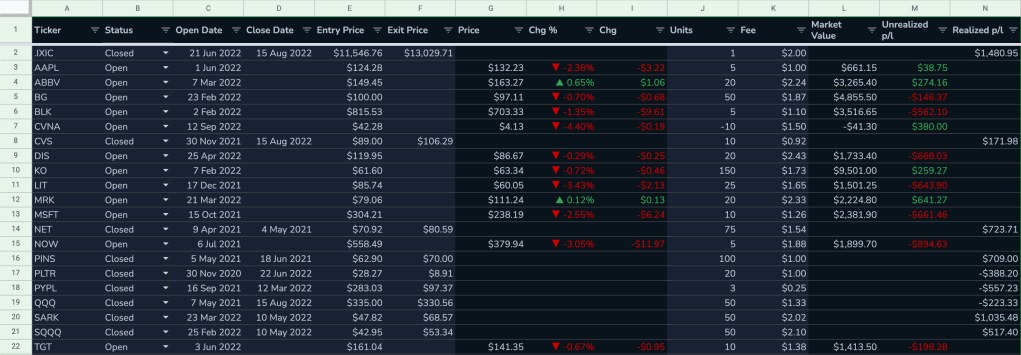
To recap, here is how the mock portfolio looks like currently (23 Dec 2022). Considering more positions are added to the portfolio, it would be helpful if we can have an overview of the relative size of each position in the form of a pie chart. This can inform our investment decisions going forward. Using the data from column A (ticker) and column L (market value), a pie chart can be generated. Simply click on the chart icon (“Insert chart”) in the top menu, under “Chart type”, select “Pie chart”. In data range, type in:
A1:A,L1:LWith the pie chart available, you can now view the position sizes from the largest to the smallest by sorting column L.
Please note that short positions are not included in this chart as the market value is a negative number.

Next, we’re going to build multi-currency support into our tracker. This involves building a currency list, and adding the currency conversion capability to the tracker so that it displays the correct p/l of a multi-currency portfolio. Please note that historical FX rates are not included in this tracker as the main purpose of the tracker is to show current p/l.
I have prepared a list of all currencies and their symbols in a separate Google sheet. Now, we’ll start a new tab, rename it “Ref”, and in cell A1, use the IMPORTRANGE function to pull the data from that referenced sheet. We’ll pull columns A to C. They contain currency name, currency code and currency symbol respectively.
=IMPORTRANGE("https://docs.google.com/spreadsheets/d/1WIxNPW4WNR4JgLCy8qjfDLdbSD8TcnvGXuILK1LQ-v8/","Currency Symbols!A:C")
There will be more data that needs to be referenced as we build more functionalities into the tracker. The way I’ll structure this is that within the master referenced sheet, I’ll have separate tabs for each unique dataset (e.g. currency symbols, asset type, fee type etc.), but in the tracker sheet, I’ll use IMPORTRANGE to pull all dataset from the referenced sheet into a single tab to avoid too many tabs. If you’re a bit lost, you’ll understand how it works in the next post.
The master referenced sheet is publicly accessible and you’re free to reference it for your own projects. When you import the sheet for the first time, you’ll see a pop-up asking you to allow access to the sheet. Just click “Allow access”.
With the currency list set up, we can now head back to the tab showing the stock positions (I named it “Positions”), and add a column on the right of column D, and name the header “Currency”. Then, we’ll make a dropdown menu in each cell of column E to allow the selection of currencies. First, select cell E2:E, go to “Data” > “Data validation”, under validation rules, add a new rule that applies to range “Positions!E2:E50”. Under criteria, select “Dropdown (from a range)”, type in “‘Currency Symbols’!B$2:B” as the range. Click “Done”.
With this column set up, we can now label the currency of each stock position. Since all positions we have now are US stocks, let’s type in “USD” in cell E2, then copy down the value by selecting the rest of the rows by pressing Ctrl+D in Windows or Cmd+D in Mac.
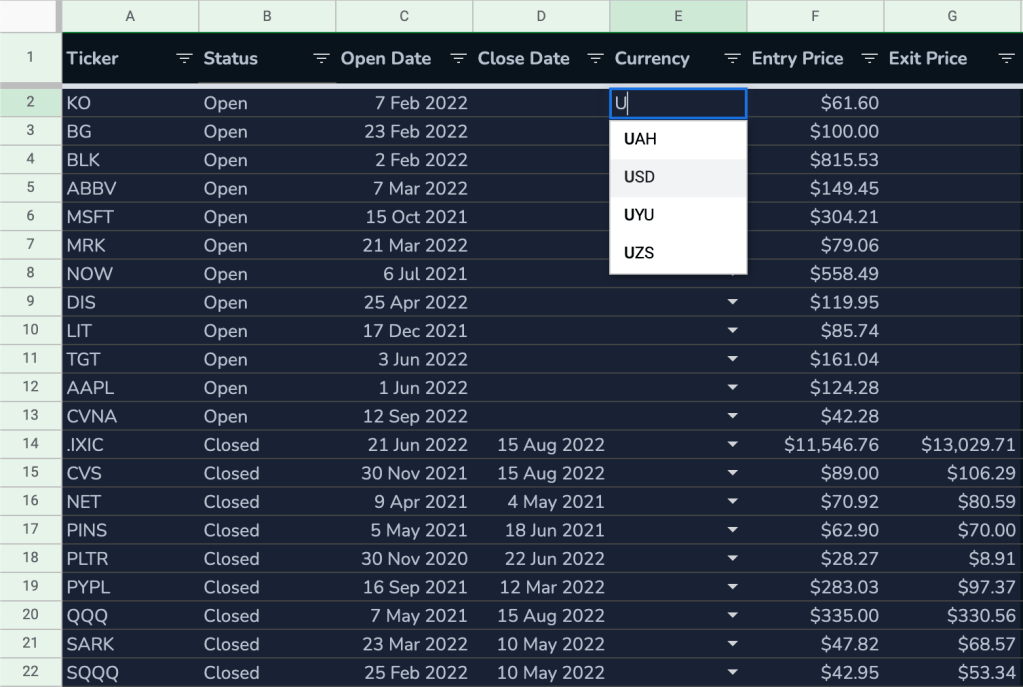
A nice little thing Google Sheet offers it the ability to search the items in the dropdown menu so you don’t have to scroll through the whole list looking for the symbol.
Now, we’ll set up another column to display the correct currency symbol for the stock positions since not everything is priced in dollars. First, let’s reformat the data in Entry Price and Exit Price column (G2:G and H2:G respectively) as numbers. Then, add a column on the right of column E and type in this formula:
={"Cyrrency Symbol";ArrayFormula(IF(E$2:E="",,XLOOKUP(E$2:E,'Currency Symbols'!$B$2:$B,'Currency Symbols'!$C$2:$C)))}This formula pulls the correct currency symbol from the referenced sheet depending on the currency you input in column E.
We’ll use USD as the currency in which the p/l of our multi-currency portfolio is displayed in. That means we have to convert the Entry Price and the Exit Price of the non-US stock positions into USD. To do that, let’s add a column on the right of the Entry Price, the Exit Price and the Price column respectively. Let’s rename them Entry Price (USD), Exit Price (USD) and Price (USD) respectively for now. These columns display the USD price automatically calculated from the manual input columns.
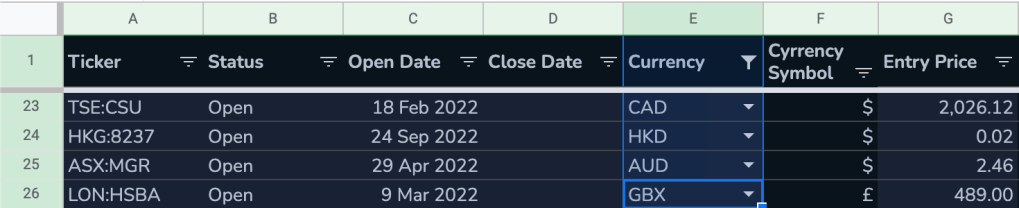
To help visualize the calculation of p/l of non-US stock positions, let’s add some non-US holdings into our portfolio. This is going to help us observe how the formulas work in real time and spot errors. I’ll use the following tickers: TSE:CSU, HKG:8237, ASX:MGR, LON:HSBA. Please note that the letters before the “:” refer to the stock exchange and the letters after the “:” are the ticker. It is important to type in the stock exchange symbol to make sure Google pulls the correct price data. To see an exhaustive list of available securities, please see this link.
We need the Entry Price (USD) column (now column H) to display the USD price. Therefore, it needs to check the Currency column. If it is “USD”, then it would just display the same USD price as what’s typed in. If it is any other currency, it will perform a currency conversion using the FX rates provided by GOOGLEFINANCE to show the price in USD. One particular currency that needs special attention is the UK pence (GBX) as it is how the stocks on the London Stock Exchange are quoted in. So in cell H1, we’ll write a formula that checks whether the currency is GBX, if yes, it will convert the price into GBP divided by 100, if no, it’ll go on to check what currency it is, and perform a currency conversion if needed.
={"Entry Price (USD)";MAP($E2:$E,G2:G,LAMBDA(currency,entry_price,IF(Currency="",,ROUND(IFS(currency="GBX",(GOOGLEFINANCE("GBPUSD")*entry_price)/100,currency="USD",entry_price,LEN(currency),GOOGLEFINANCE(Currency&"USD")*entry_price),2))))}We’ll apply the same to the Exit Price (USD) (column J). Since we only need to see the exit price in USD after a position is closed, we’ll add another argument to the MAP function like this:
={"Exit Price (USD)";MAP($E2:$E,I2:I,$B2:$B,LAMBDA(currency,entry_price,status,IF(status="Closed",ROUND(IFS(currency="GBX",(GOOGLEFINANCE("GBPUSD")*entry_price)/100,currency="USD",entry_price,LEN(currency),GOOGLEFINANCE(Currency&"USD")*entry_price),2),)))}Then, in column L, we’ll put in this formula so we can see the current USD price of any open positions:
={"Price (USD)";MAP($E2:$E,K2:K,$B2:$B,LAMBDA(currency,entry_price,status,IF(status="Open",ROUND(IFS(currency="GBX",(GOOGLEFINANCE("GBPUSD")*entry_price)/100,currency="USD",entry_price,LEN(currency),GOOGLEFINANCE(Currency&"USD")*entry_price),2),)))}Since the columns showing the Market Value, Unrealized p/l, Fee and Realized p/l are still referencing the columns that could now have non-US prices, we’ll updated their formulas to reference the correct column as follows:
Fee (now column Q)
={"Fee (USD)";MAP($E2:$E,P2:P,LAMBDA(currency,entry_price,IF(Currency="",,ROUND(IFS(currency="GBX",(GOOGLEFINANCE("GBPUSD")*entry_price)/100,currency="USD",entry_price,LEN(currency),GOOGLEFINANCE(Currency&"USD")*entry_price),2))))}Market Value (now column R)
={"Market Value";ArrayFormula(IF(A2:A="",,IF(B2:B="Closed",,L2:L*O2:O)))}Unrealized p/l (now column S)
={"Unrealized p/l";ArrayFormula(IF(A2:A="",,IF(B2:B="Closed",,(L2:L-H2:H)*O2:O)))}Realized p/l (now column T)
={"Realized p/l";ArrayFormula(IF(B2:B="Closed",(J2:J-H2:H)*O2:O-Q2:Q,""))}
There are a few caveats in using GOOGLEFINANCE though. First, quotes are not sourced from all markets and may be delayed up to 20 minutes. Also, it does not pull data from the following exchanges:
- Thailand Stock Exchange
- Bursa Malaysia
- Singapore Exchange
- Shanghai Stock Exchange
- Tokyo Stock Exchange
- Moscow Exchange
There are ways to remedy these shortcomings but that’ll be a topic of another post. So stay tuned!
To be continued.
Save yourself the trouble of making a portfolio tracker from scratch by using the ZestFi Stock Portfolio Tracker. Not your typical Google Sheet template, the ZestFi Stock Portfolio Tracker lets you easily track all your stocks even if you have multiple accounts, own different types of assets, and hold multiple currencies! This tracker makes use of the GOOGLEFINANCE API to fetch stock price updates and provides powerful analytics presented in a ultra clean dashboard, helping you make the best investment decisions. Say goodbye to the hassle of going back and forth between different apps and website to manage your investments, and say hello to ZestFi!
