In our previous blog post, we delved into the world of alpha and its significance in investment analysis. Today, we’re taking it further: by exploring how to calculate two key performance metrics, alpha (α) and beta (β), for your investment portfolio right within Google Sheets™. But first, let’s quickly recap what alpha and beta represent.
Alpha (α): Alpha is a measure of an investment’s excess return compared to its expected return, considering its level of risk. A positive alpha indicates outperformance, while a negative alpha suggests underperformance. For a more detailed explanation, you can revisit our previous blog post on Understanding Alpha in Investment Analysis.
Beta (β): Beta measures the sensitivity of an investment’s returns to market movements. A beta of 1 indicates the investment moves in sync with the market, while a beta greater than 1 suggests it’s more volatile, and a beta less than 1 implies it’s less volatile. A negative beta indicates an inverse relationship with the market.
The CAPM Model
Before we dive into the calculations, it’s important to understand the foundation upon which alpha and beta are built—the Capital Asset Pricing Model (CAPM). CAPM is a key tool in finance that helps us determine expected returns based on risk and the market’s performance. It forms the basis for calculating alpha and beta by considering an investment’s risk (beta) and the risk-free rate of return.
Calculating Alpha (α) and Beta (β) in Google Sheets™
Now, let’s get practical. We’ve prepared a Google Sheets ™template that simplifies the process of calculating alpha and beta for your investment portfolio. Here’s how you can access and use it:
- Download the Google Sheets™ Template: We’ve created a spreadsheet that will be continually updated with examples and functionalities. To access it, simply click the button above.
- Access to the Sheet Forever: Once you’ve downloaded it via our Gumroad page, you’ll have unlimited access to the template. You can also make a copy of the sheet to experiment with various performance metrics using your own portfolio data.
- Stay Updated: The best part? We’ll keep updating the spreadsheet with new examples and features, so you don’t have to worry about a thing.
- Add a Shortcut to Your Google Drive™: To make your life even easier, you can add a shortcut to this invaluable tool in your Google Drive. Here are the instructions from Google on how to do it.
Without further ado, let’s dive into the tutorial! We’ll use real data from the S&P 500 and a dummy portfolio to illustrate the process.
Step 1: Data Preparation
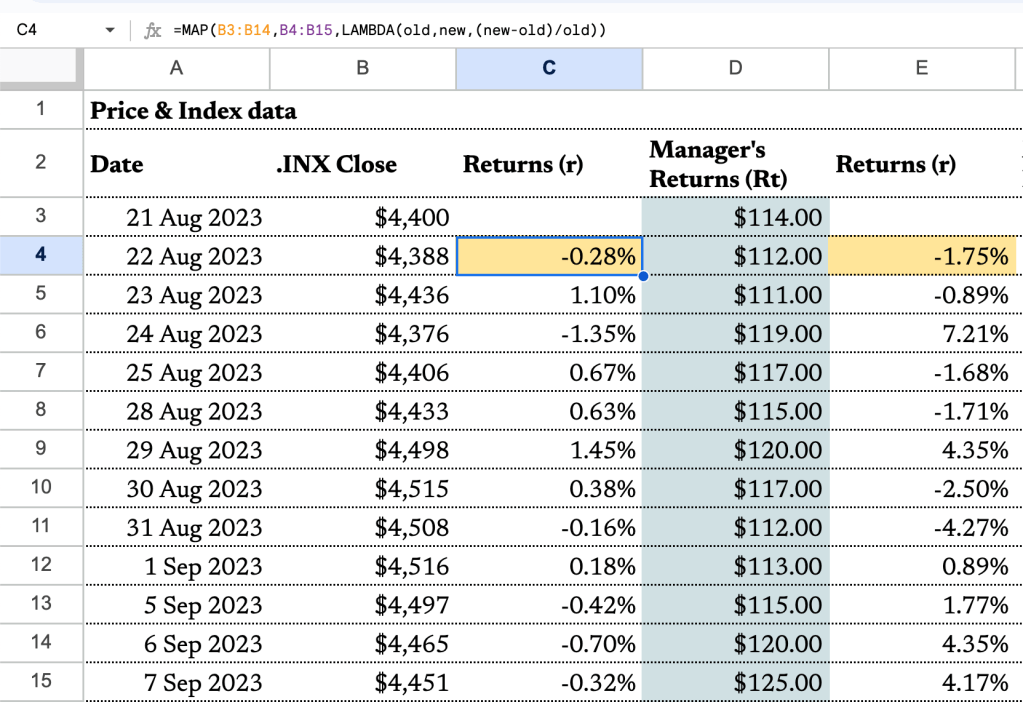
To begin, we’ll use the closing price data of the S&P 500 from August 21, 2023, to September 7, 2023. This data will serve as our market benchmark. In your Google Sheet, you should have dates in column A and S&P 500 closing prices in column B.
To calculate returns (rr), we’ll use the simple return formula: (new price−old price)/old price. In cell C4, enter the following formula:
=ARRAYFORMULA(MAP(B3:B14, B4:B15, LAMBDA(old, new, (new - old) / old)))This formula will calculate the daily return percentages and propagate them down the column.
Next, the manager’s portfolio data is in column D, and we want to calculate returns for it as well. Copy the formula in column C and paste it into column E. The formula will adjust automatically for the new data.
Step 2: Market Returns
To calculate excess returns, we need data for market returns. In column F, we’ve used U.S. 6-Month Treasury Bill Data from MarketWatch. Since this data is annualized, we need to convert it back to daily returns. In cell G3, enter this formula:
=ARRAYFORMULA((1+F3:F15)^(1/365)-1)his formula annualizes the rate data and converts it to daily returns.
Step 3: Calculate Excess Returns
Now that we have the necessary data in columns C, E, and G, we can calculate the excess returns. In cell H4, enter this formula to calculate the excess return of the S&P 500:
=ARRAYFORMULA(C4:C15 - G4:G15)In cell I4, enter this formula to calculate the excess return of the manager’s portfolio:
=ARRAYFORMULA(E4:E15 - G4:G15)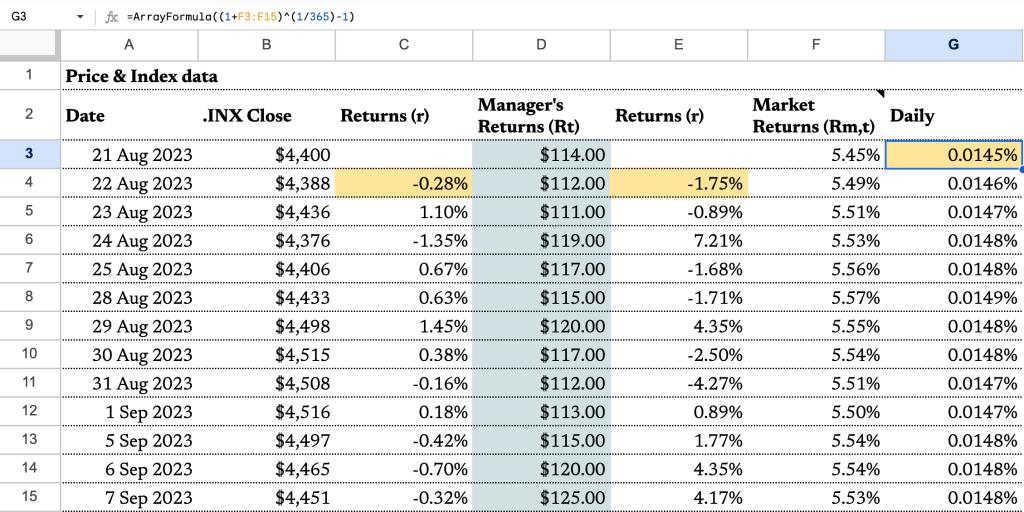
Step 4: Calculate CAPM Alpha and Beta
We’re now ready to calculate the CAPM alpha and beta.
- For alpha, which measures excess return, we’ll use the INTERCEPT function. The reason for using INTERCEPT is that it calculates the vertical intercept of a linear regression, giving us the alpha:
=INTERCEPT(I$4:I$15, H$4:H$15)- For beta, which measures market sensitivity, we’ll use the SLOPE function. SLOPE calculates the slope of a linear regression, providing us with the beta:
=SLOPE(I$4:I$15, H$4:H$15)Step 5: Interpretation

The results are in:
- The alpha is 0.9633%, indicating that the manager’s portfolio has generated a positive excess return compared to the risk-free rate.
- The beta is -1.7816, suggesting that the manager’s portfolio has a negative correlation with the S&P 500, meaning it moves in the opposite direction of the market.
Conclusion
In this tutorial, we’ve demonstrated how to calculate alpha and beta for your investment portfolio using Google Sheets. These metrics provide valuable insights into your portfolio’s performance and risk exposure. Understanding alpha and beta is essential for making informed investment decisions and assessing the effectiveness of your investment strategies. As you continue to refine your investment approach, these tools will be instrumental in evaluating and optimizing your portfolio. Stay tuned for more financial insights and practical tools to empower your financial journey.
