Welcome to
ZestFi
Optimize Your Finances, Maximize Your Life
Product Suite
Powered by Google Sheets™. Supercharged with AppScript.
Simplifying your life one spreadsheet at a time.
Income & Expense Tracker
Effortlessly track income and expenses in any currency with custom categories and analytics. New features include automated billing reminders, batch transaction input, and Flex Queries.
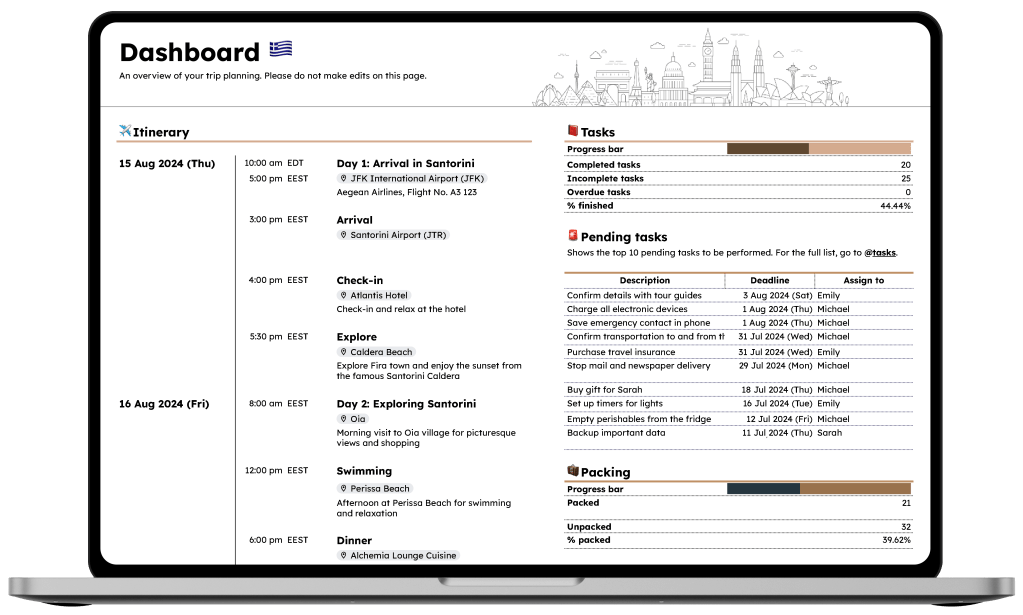
Ultimate Travel Organizer
Assign tasks to trip participants, track progress, and send reminders with a click. Convert timezones effortlessly. Stay on top of expenses in multiple currencies, manage transactions, and split costs seamlessly.
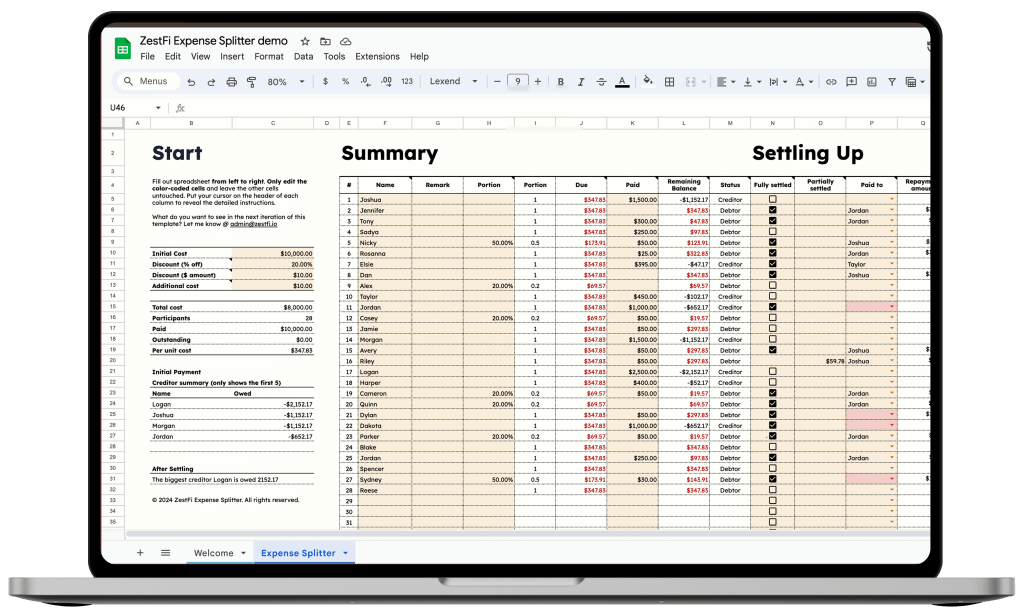
ZestFi Expense Splitter
Easily split bills with a simple 3-step process. Keep precise records of who paid what, manage exemptions and customized portions, and save time with automatic calculations. Track settled debts—all on a single page.
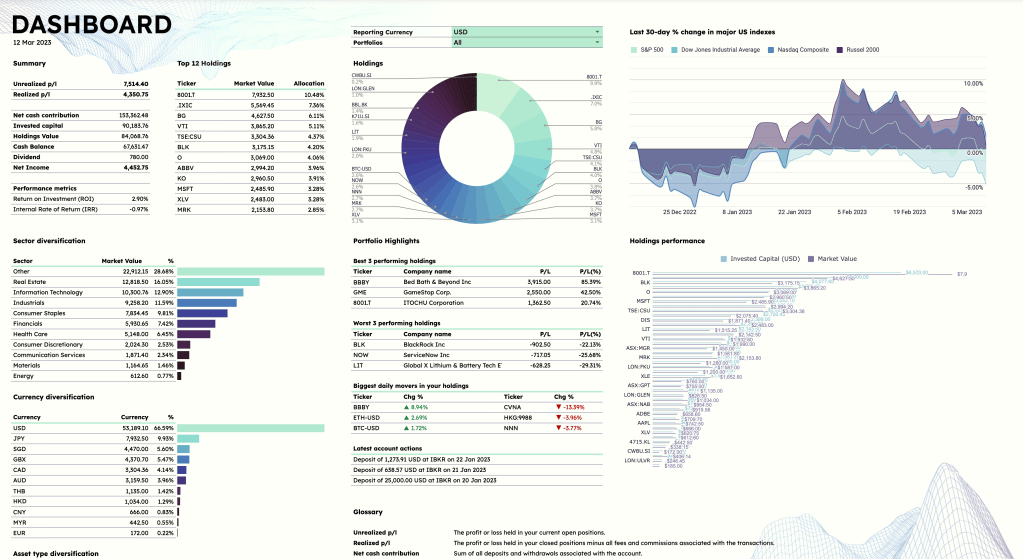
Stock Portfolio Tracker
Track stocks, ETFs, REITs, and more in multiple portfolios, including international stocks. Enjoy advanced performance metrics, flexible sorting, and beautiful dashboards in any currency.
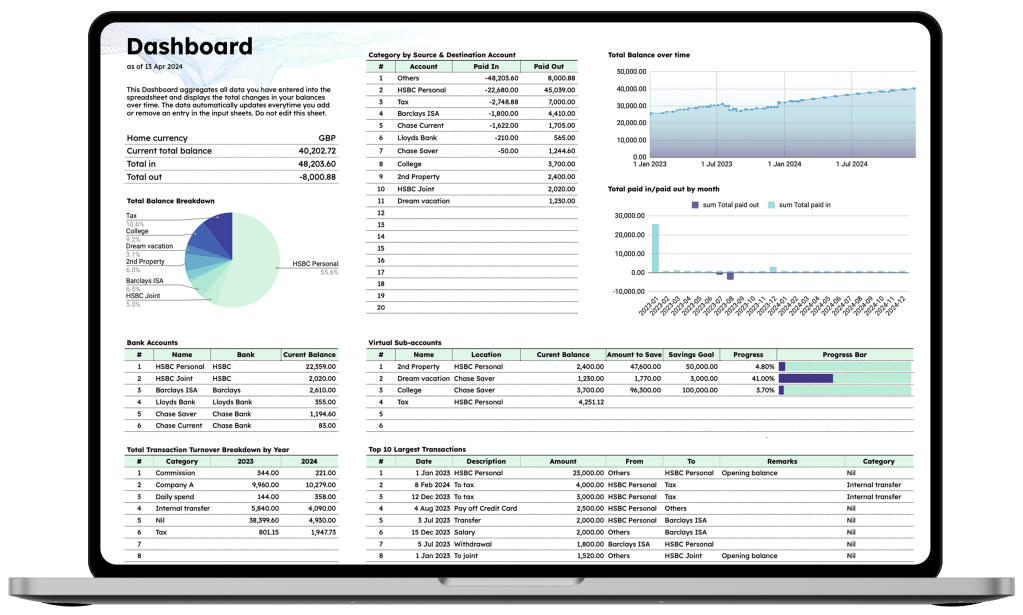
Multi-Account Balance Manager
Consolidate all bank statements into one. Gain insights with flexible ledger views, equity curves. Set up virtual sub-accounts for specific saving goals. Stay organized with customizable categories and advanced analytics on the dashboard.
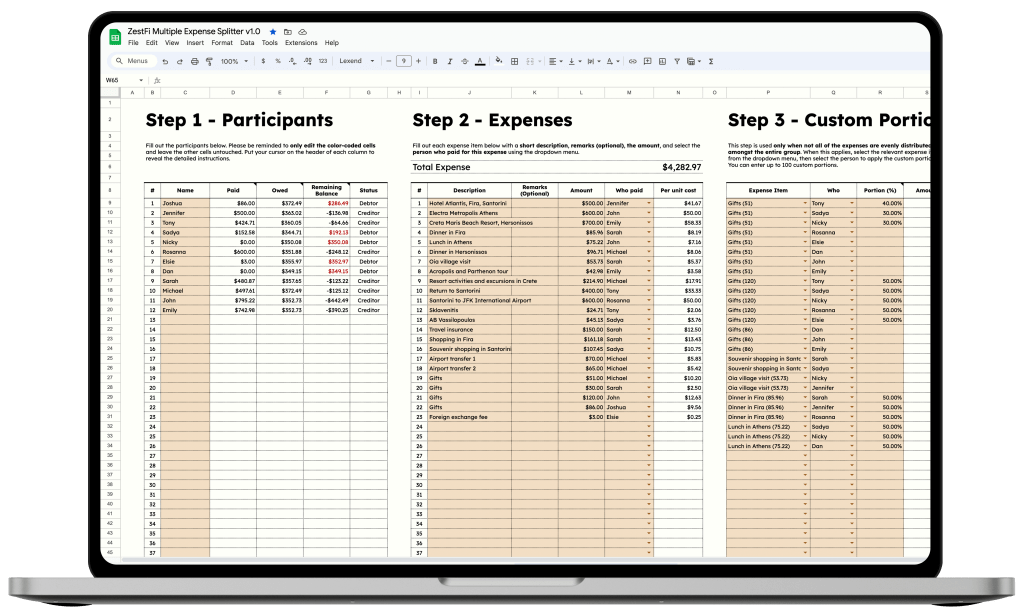
ZestFi Multiple Expense Splitter
Perfect for group trips or lunches with colleagues. Split complex costs, keep records of multiple expenses, manage exemptions and customized portions, save time with automatic calculations, and track settled debts—all on a single page.
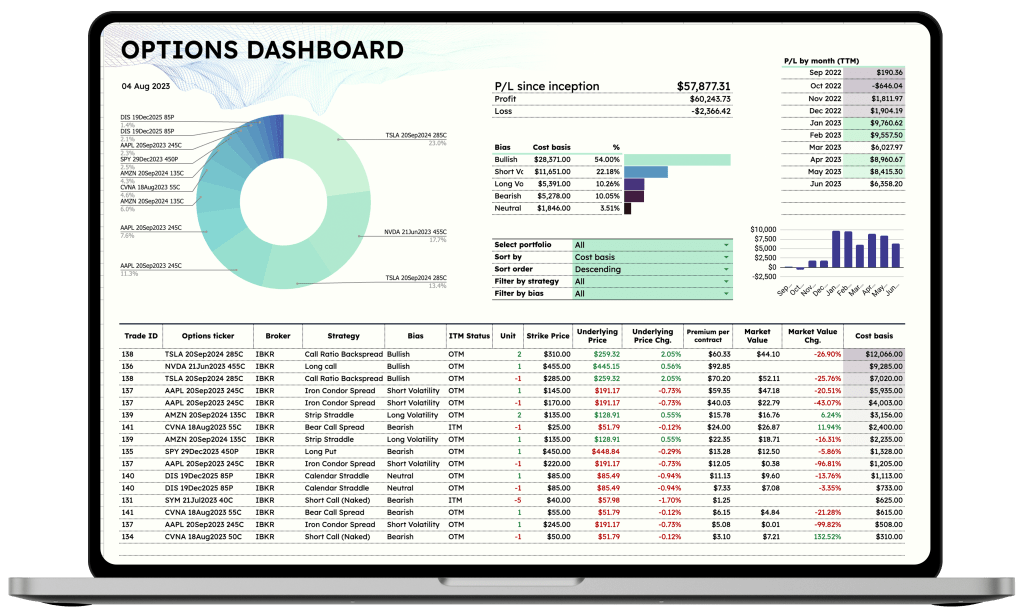
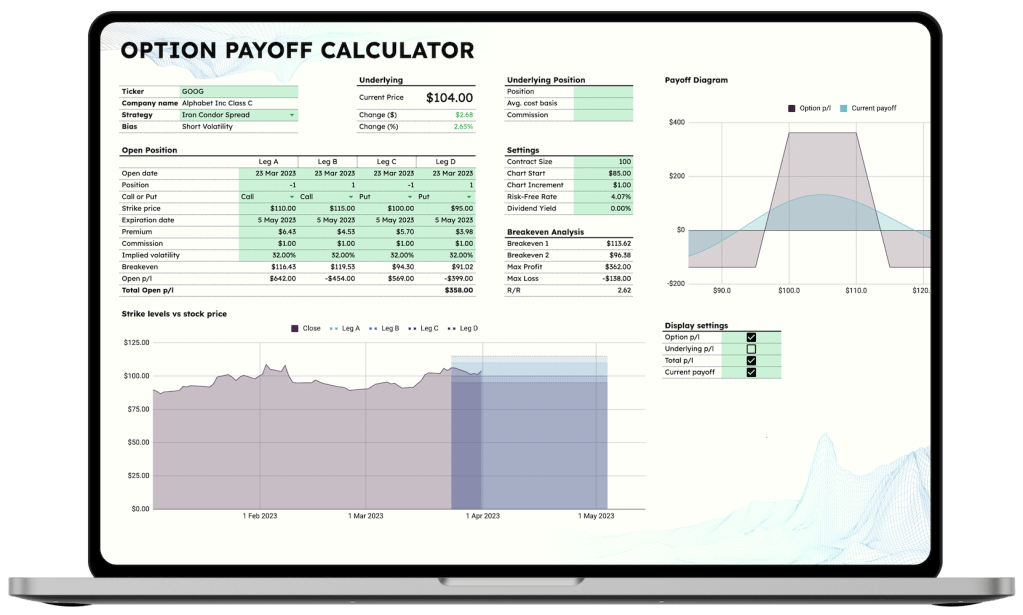
Options Strategist
Log your options trades p/l and analyze them. Calculate options payoff for up to 4-legged strategies, including those involving underlying stock holdings. Visualize strike levels versus stock price and manage multiple option portfolios effortlessly.
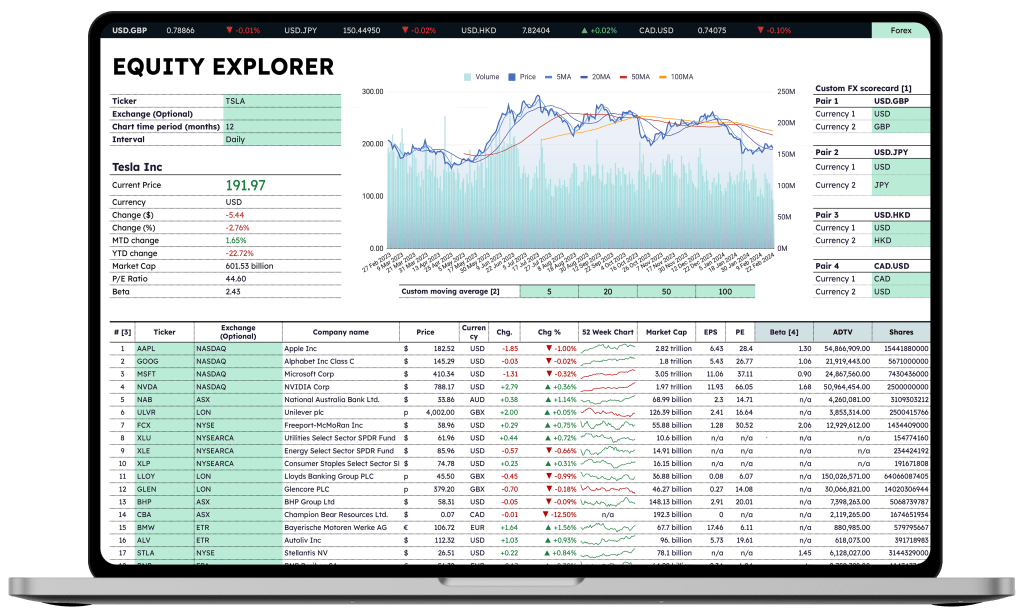
Equity Explorer
Access live quotes from major indexes and forex markets. Customize up to 4 FX pairs and moving averages for detailed chart analysis. Enhance your view with three additional customizable columns of financial metrics.
Freebies
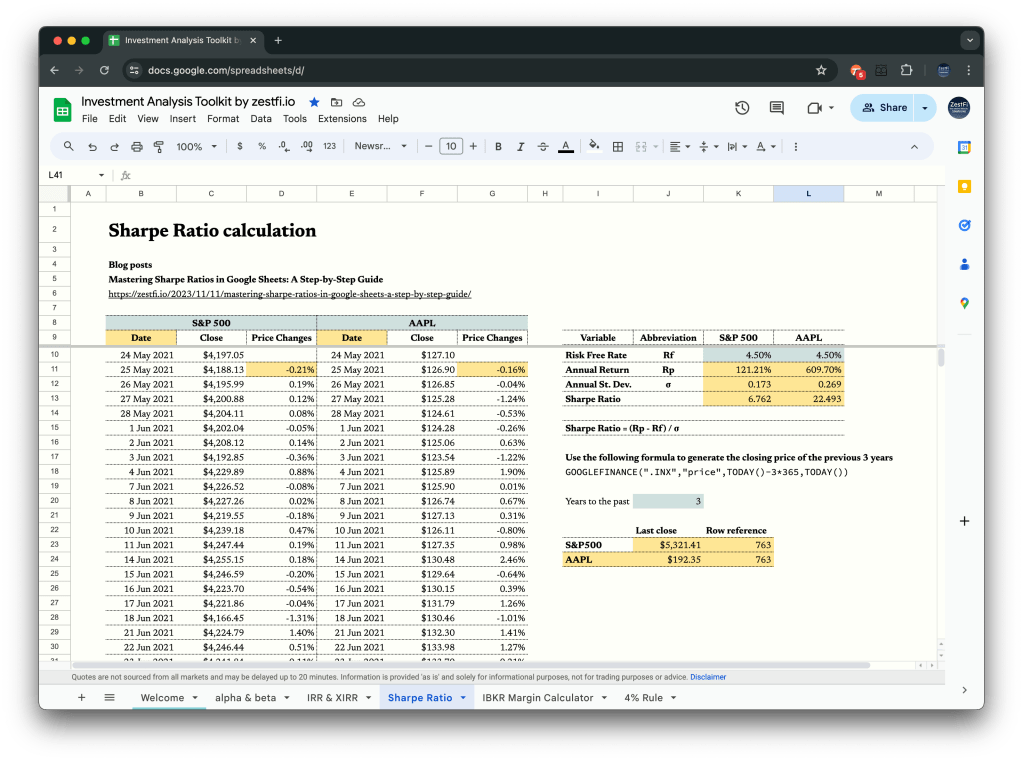
Investment Analysis Toolkit
An ever-growing collection of financial templates designed to help you analyze stock portfolios and manage your personal finances more effectively.
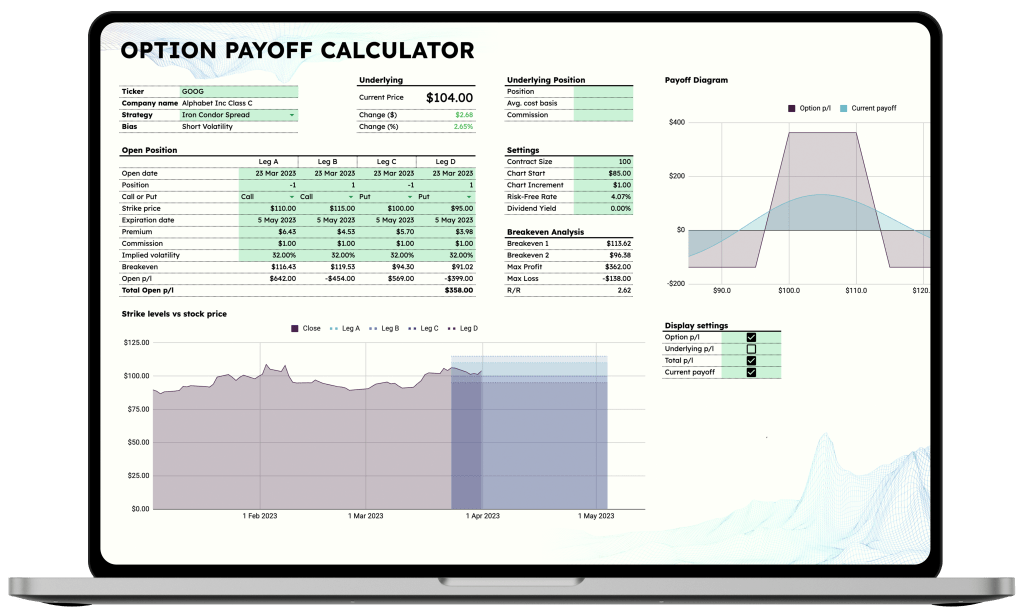
Options Payoff Calculator
Calculate your option payoff in seconds. Visualize strike levels versus stock prices, and calculate P/L for stock-based strategies like covered calls. Save time and energy and focus on refining your option strategy with our clean, user-friendly interface.
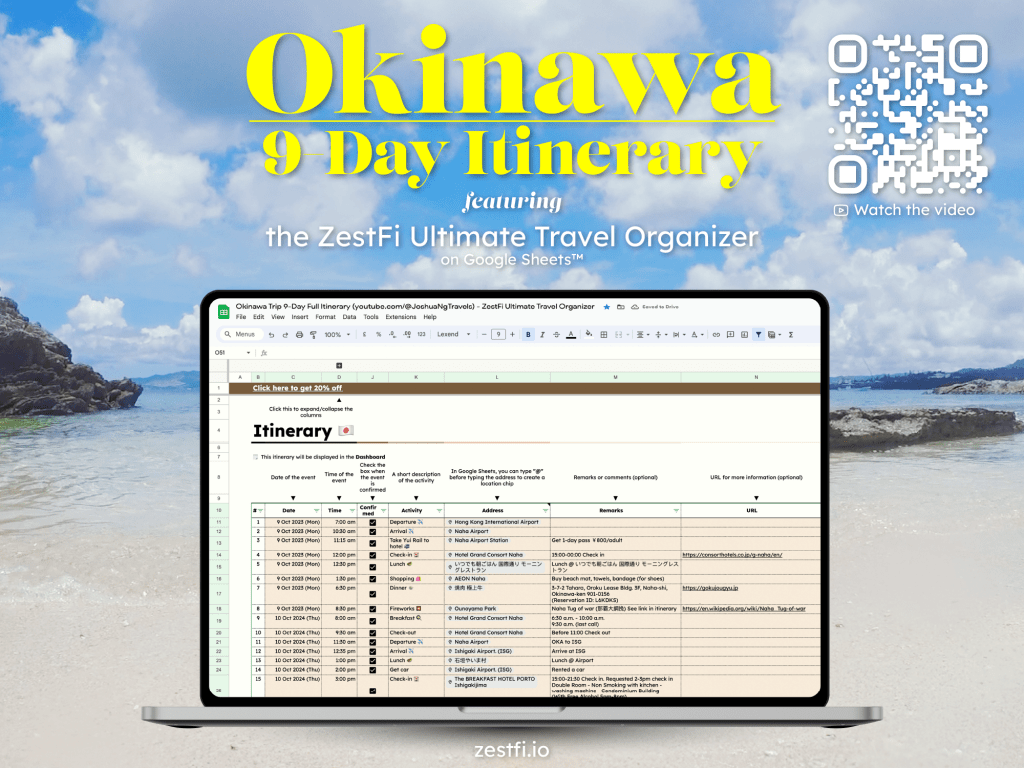
Ultimate Travel Organizer Demo (with discount code)
Explore the template with this free demo, showcasing features from research, planning and a full itinerary to expense breakdowns of a real trip.
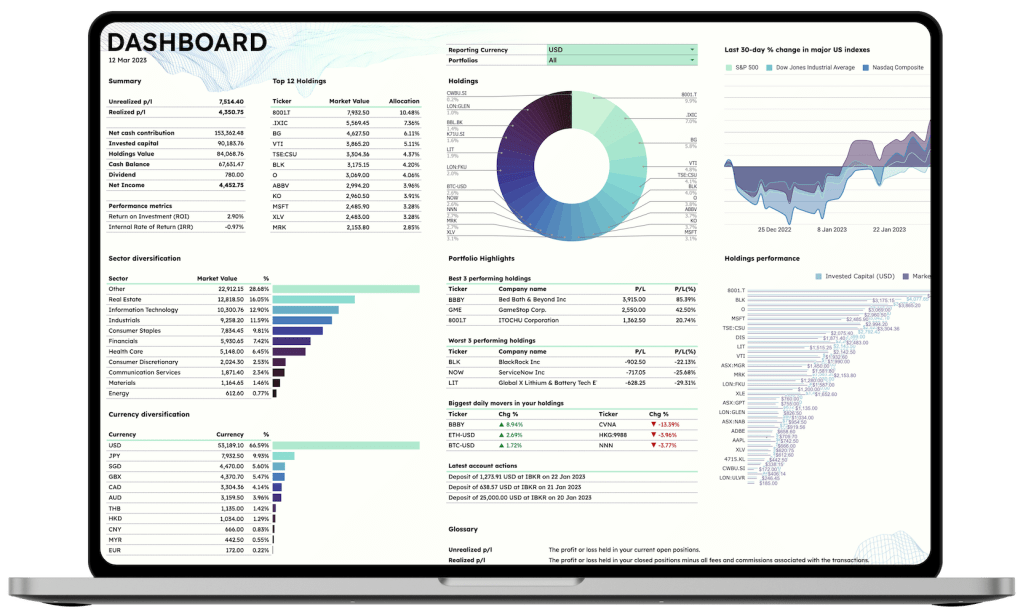
The BEST stock portfolio tracker on Google Sheets
Your ultimate companion for managing and monitoring your investments. Track stocks, ETFs, REITs, indexes, and more across multiple portfolios.
See it in action
Want to learn more about our Income & Expense Tracker? Check out this demo.
Into options trading? Get a payoff calculator for FREE
We got great news for you. Unsure about getting the more advanced Options Strategist? Try our free Option Payoff Calculator now and experience it firsthand.
Check out the latest blog posts
-
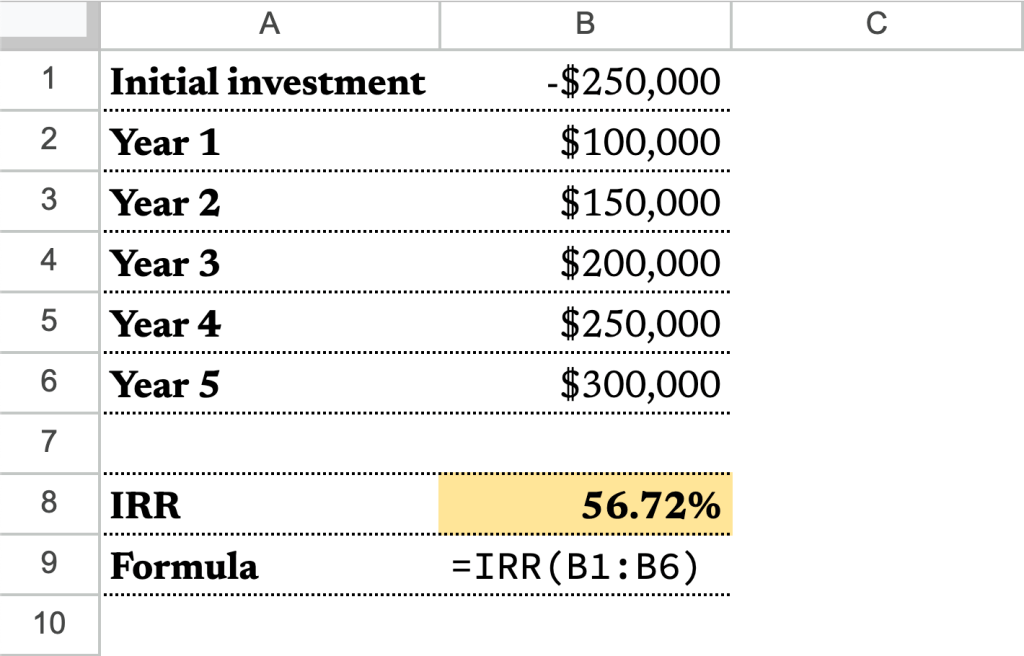
ROI vs IRR: Unraveling the Investment Portfolio Performance Puzzle
Hey there, fellow investors! It’s time to dive into a classic debate in the world of finance: Should you use ROI (Return on Investment) or IRR (Internal Rate of Return) to evaluate your investment portfolio performance? Buckle up as we explore this topic and help you make an informed choice. Understanding the Basics: ROI vs.…
-

Mastering Spreadsheets: ZestFi’s Guide to Spreadsheets Excellence
Hey everyone, Spreadsheets, oh boy! These digital workhorses are more than just cells and formulas; they’re the unsung heroes of organization and analysis. Whether you’re crunching numbers, managing finances, or decoding data, you want to do it like a pro. Well, I’ve got you covered with the ZestFi style of spreadsheet mastery. Let’s dive in!…
-
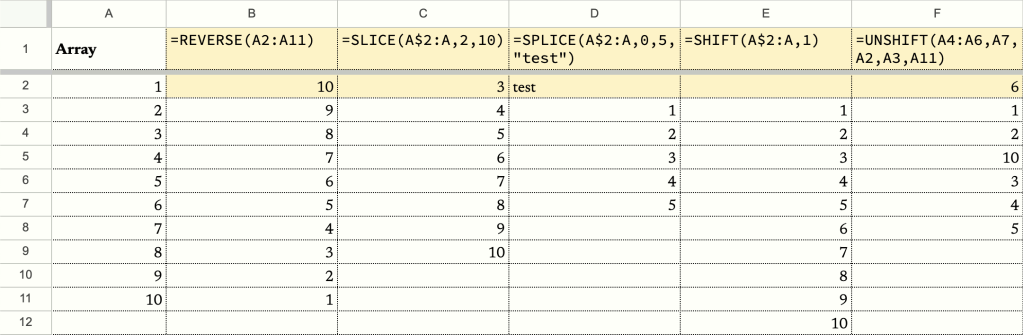
Slice, Splice, Shift, Unshift – Google Sheets custom functions for array operations
If you’ve spent hours tinkering with Google Sheets, you’ve probably encountered the frustration of wanting to remove the header from an array, only to discover that there’s no built-in formula for that. How frustrating! But luckily, Google Sheet lets us create our own formulas. There’re two ways to do so. The first one is through…
-
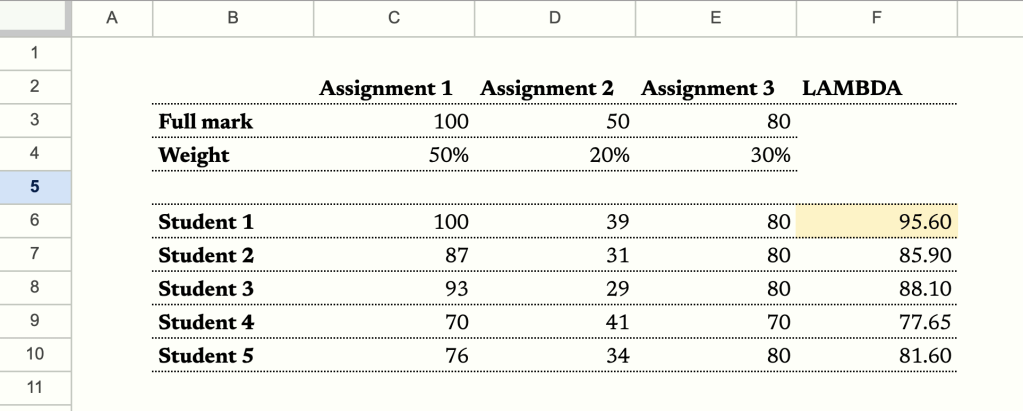
How to calculate weighted total with a named function in Google Sheets (A must-read for teachers)
In this post I’m going to diverge from the usual topic of finance and focus on a powerful feature of the Google Sheets, named functions. I’m going to demonstrate how to create a named function to boost your productivity and use it in conjunction with LAMBDA functions. When I was working as a teacher, I…
-
Master the Art of Chart Design: Unleash Your Inner Data Maestro!
In the vast realm of stock portfolio trackers, I embarked on a quest to find the perfect balance between functionality and aesthetics. Spoiler alert: my search was as fruitful as finding a unicorn in the stock market. So, I rolled up my sleeves and took matters into my own hands, crafting a stock portfolio tracker…
-

Make Your Own Portfolio Tracker In Google Sheets (Part 3)
To recap, here is how the mock portfolio looks like currently (23 Dec 2022). Considering more positions are added to the portfolio, it would be helpful if we can have an overview of the relative size of each position in the form of a pie chart. This can inform our investment decisions going forward. Using…
Subscribe
Enter your email below to receive updates.