Welcome to
ZestFi
Optimize Your Finances, Maximize Your Life
Product Suite
Powered by Google Sheets™. Supercharged with AppScript.
Simplifying your life one spreadsheet at a time.
Income & Expense Tracker
Effortlessly track income and expenses in any currency with custom categories and analytics. New features include automated billing reminders, batch transaction input, and Flex Queries.
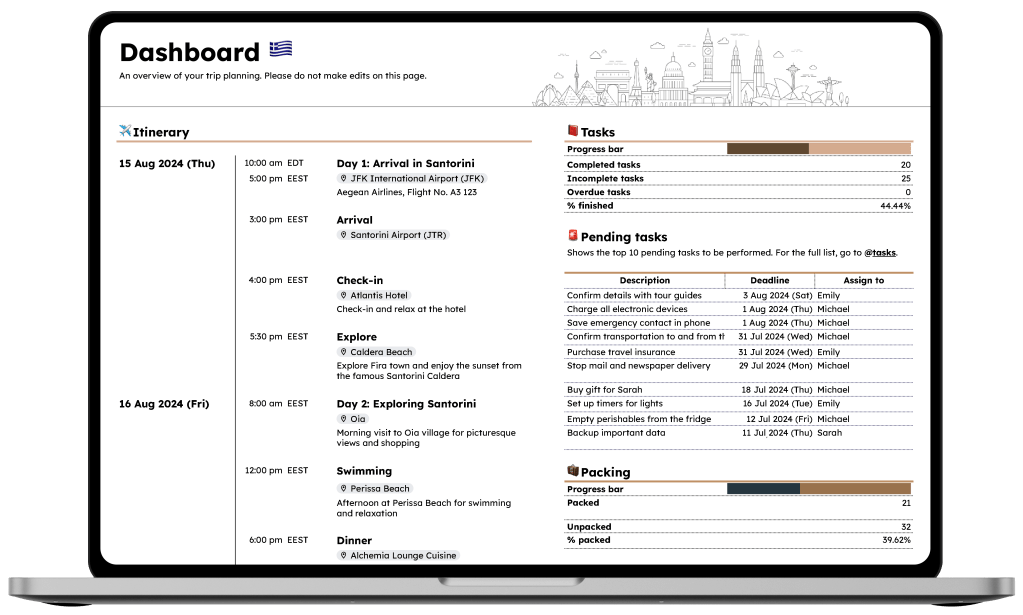
Ultimate Travel Organizer
Assign tasks to trip participants, track progress, and send reminders with a click. Convert timezones effortlessly. Stay on top of expenses in multiple currencies, manage transactions, and split costs seamlessly.
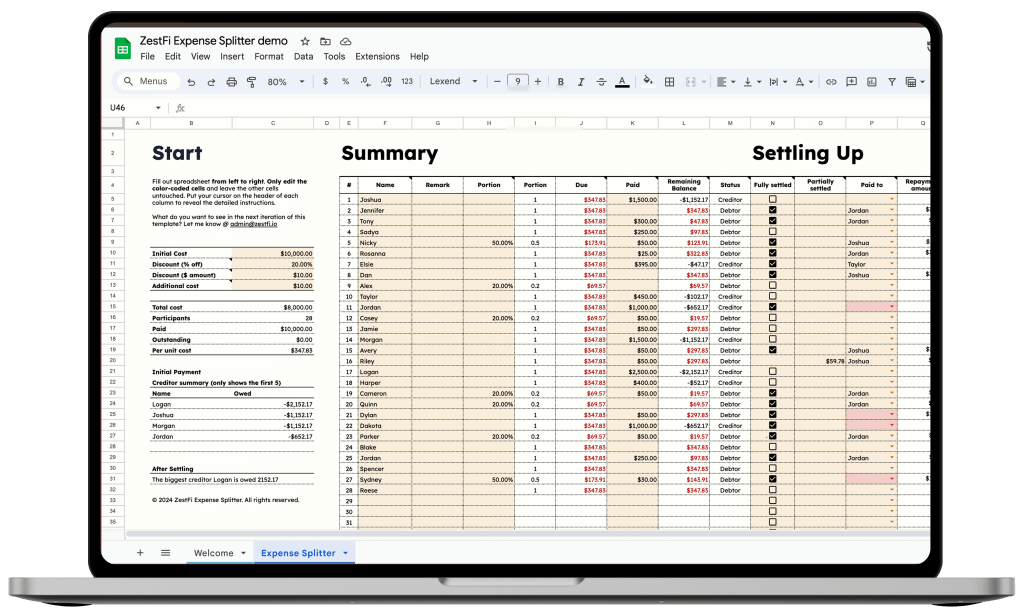
ZestFi Expense Splitter
Easily split bills with a simple 3-step process. Keep precise records of who paid what, manage exemptions and customized portions, and save time with automatic calculations. Track settled debts—all on a single page.
Stock Portfolio Tracker
Track stocks, ETFs, REITs, and more in multiple portfolios, including international stocks. Enjoy advanced performance metrics, flexible sorting, and beautiful dashboards in any currency.
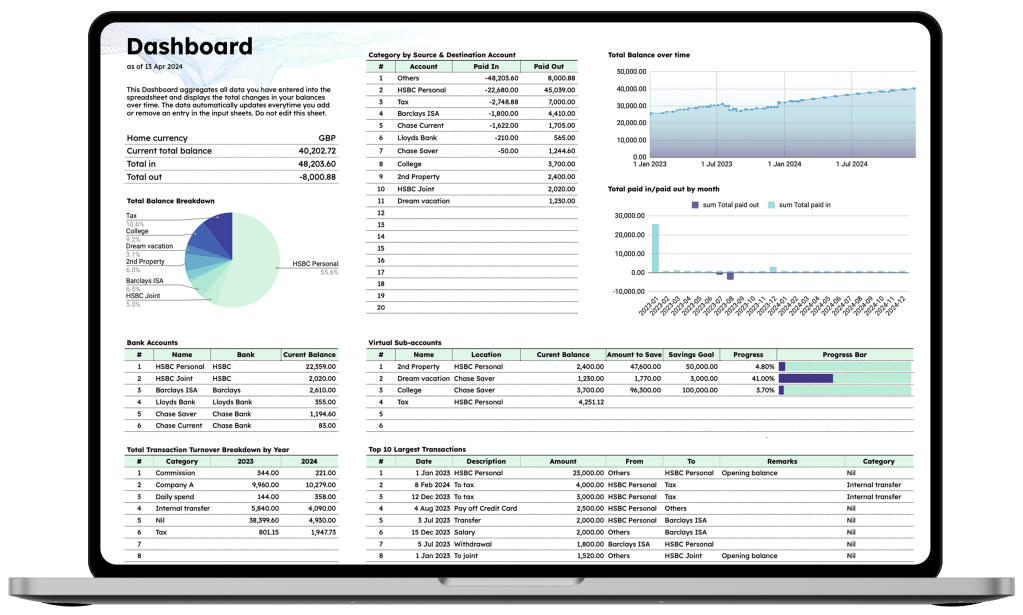
Multi-Account Balance Manager
Consolidate all bank statements into one. Gain insights with flexible ledger views, equity curves. Set up virtual sub-accounts for specific saving goals. Stay organized with customizable categories and advanced analytics on the dashboard.
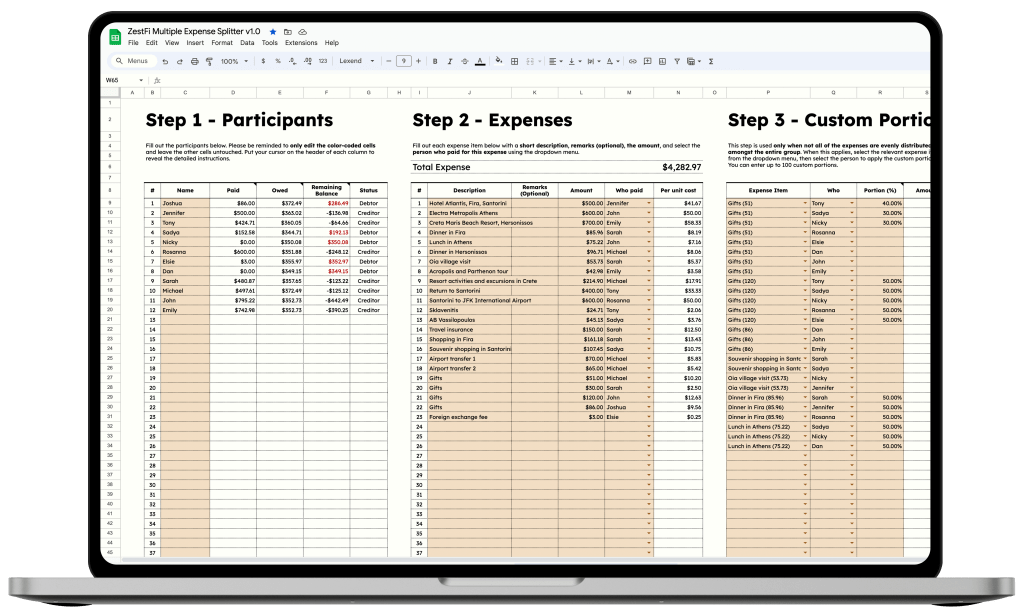
ZestFi Multiple Expense Splitter
Perfect for group trips or lunches with colleagues. Split complex costs, keep records of multiple expenses, manage exemptions and customized portions, save time with automatic calculations, and track settled debts—all on a single page.
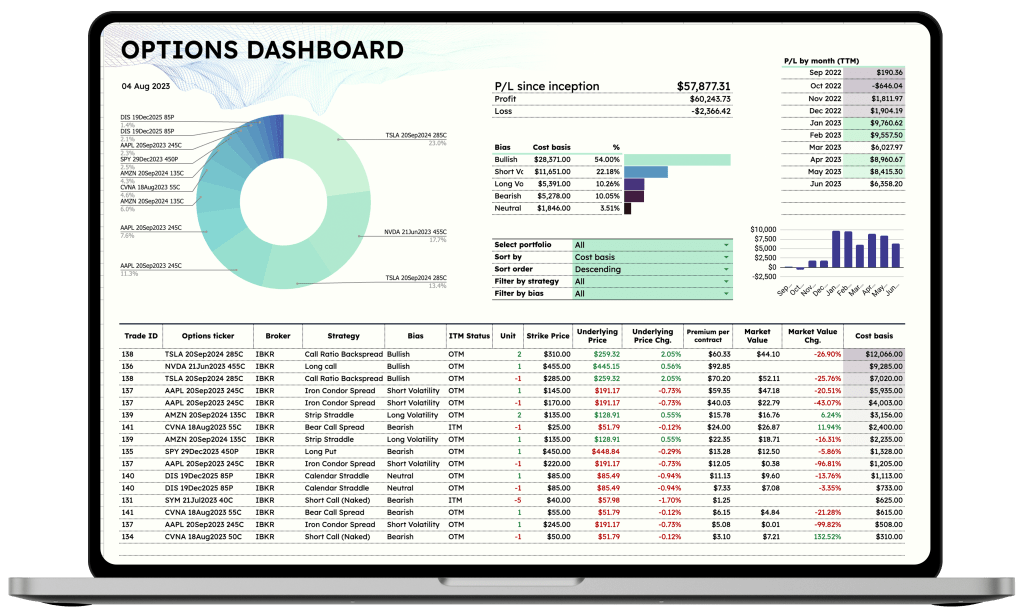
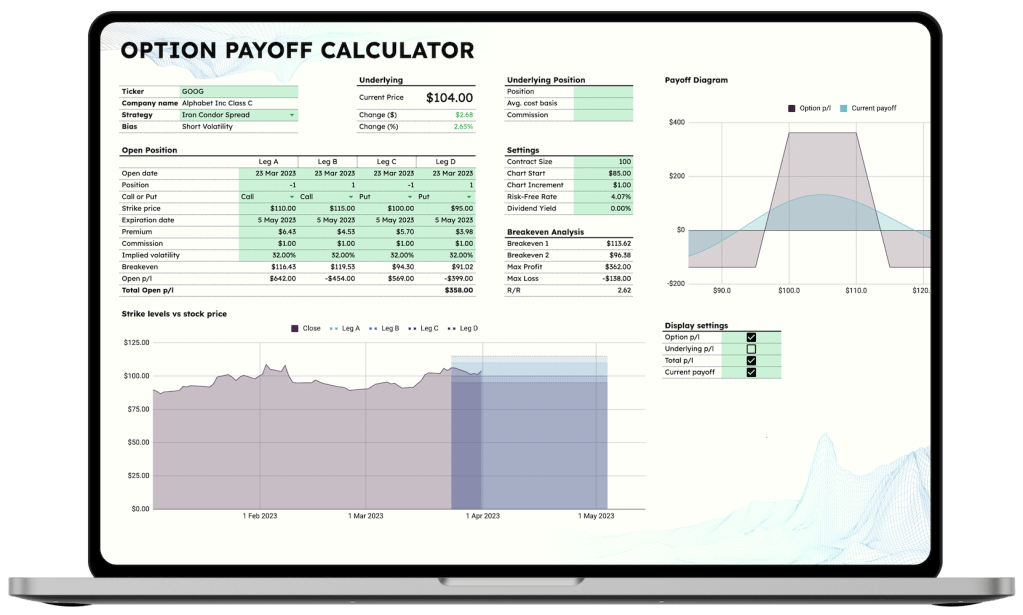
Options Strategist
Log your options trades p/l and analyze them. Calculate options payoff for up to 4-legged strategies, including those involving underlying stock holdings. Visualize strike levels versus stock price and manage multiple option portfolios effortlessly.
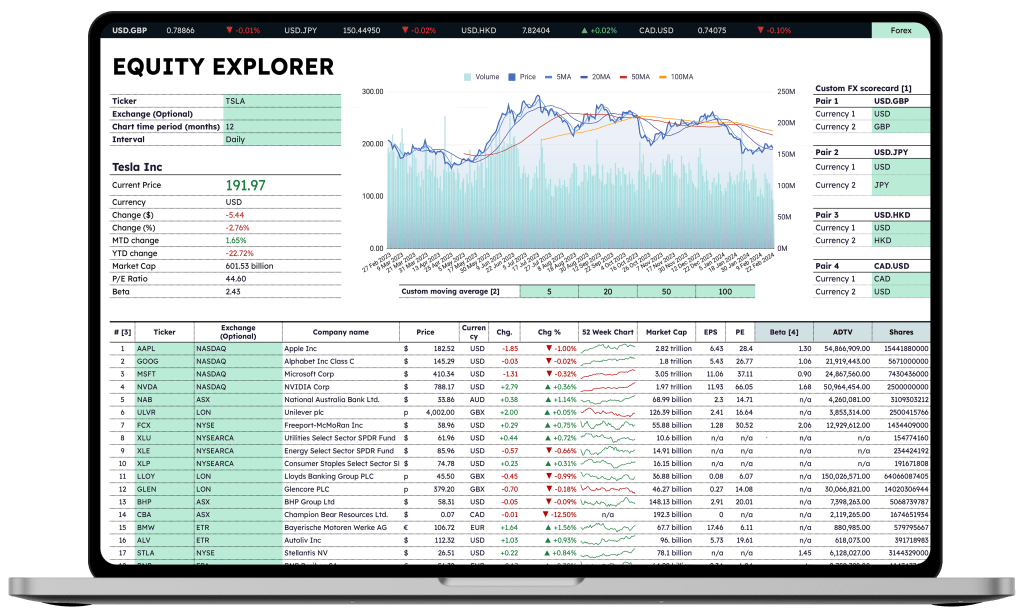
Equity Explorer
Access live quotes from major indexes and forex markets. Customize up to 4 FX pairs and moving averages for detailed chart analysis. Enhance your view with three additional customizable columns of financial metrics.
Freebies
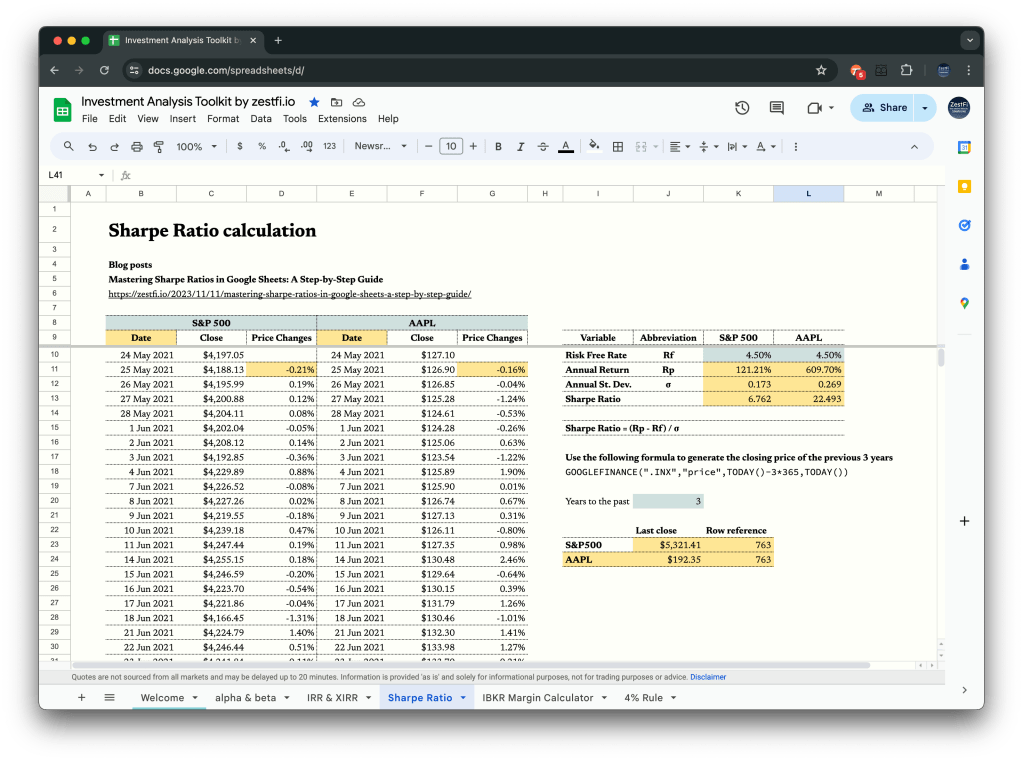
Investment Analysis Toolkit
An ever-growing collection of financial templates designed to help you analyze stock portfolios and manage your personal finances more effectively.
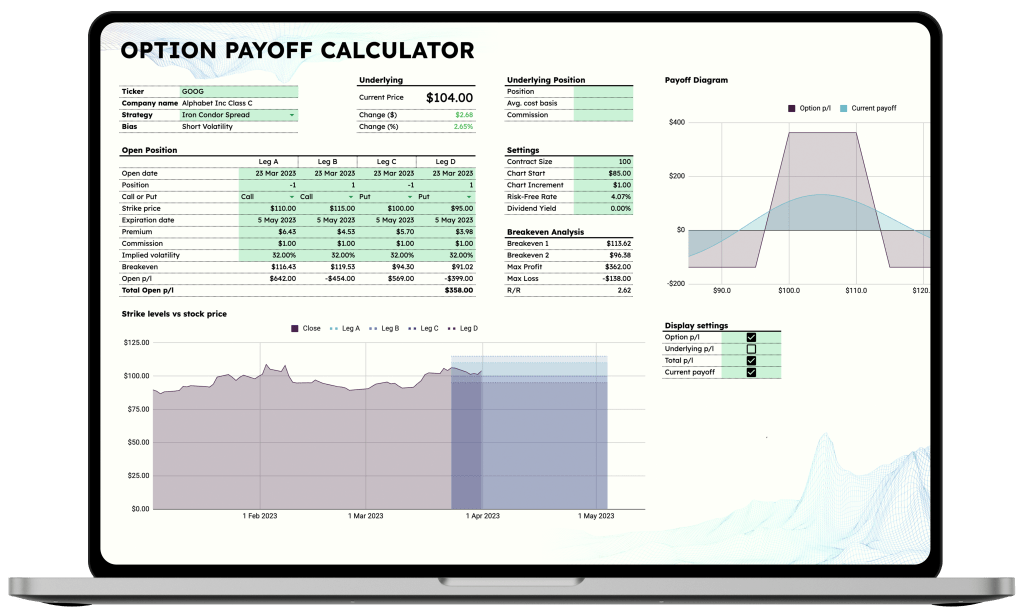
Options Payoff Calculator
Calculate your option payoff in seconds. Visualize strike levels versus stock prices, and calculate P/L for stock-based strategies like covered calls. Save time and energy and focus on refining your option strategy with our clean, user-friendly interface.

Ultimate Travel Organizer Demo (with discount code)
Explore the template with this free demo, showcasing features from research, planning and a full itinerary to expense breakdowns of a real trip.
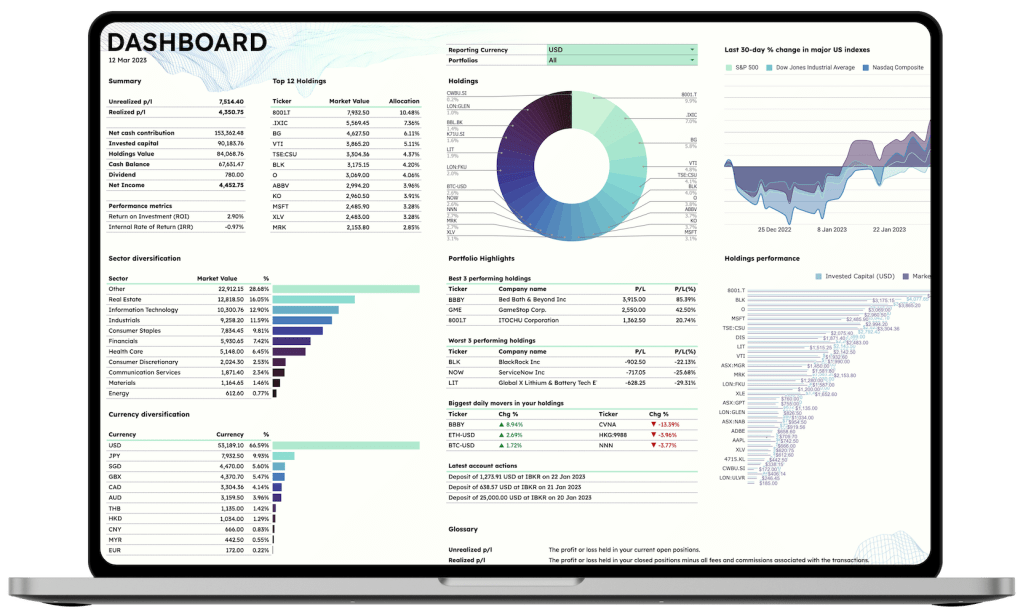
The BEST stock portfolio tracker on Google Sheets
Your ultimate companion for managing and monitoring your investments. Track stocks, ETFs, REITs, indexes, and more across multiple portfolios.
See it in action
Want to learn more about our Income & Expense Tracker? Check out this demo.
Into options trading? Get a payoff calculator for FREE
We got great news for you. Unsure about getting the more advanced Options Strategist? Try our free Option Payoff Calculator now and experience it firsthand.
Check out the latest blog posts
-

Mastering Sharpe Ratios in Google Sheets: A Step-by-Step Guide
Welcome to the world of Sharpe ratios—a powerful tool in portfolio management that helps investors assess the return of an investment relative to its risk. In this tutorial, we’ll leverage the magic of Google Sheets to calculate Sharpe ratios and compare the performance of Apple stock (AAPL) against the S&P500 over the last three years.…
-
What is the Sortino Ratio
The Sortino ratio is a risk-adjusted performance measure that calculates the return per unit of downside risk. It is similar to the Sharpe ratio, but it uses the standard deviation of negative returns instead of the total standard deviation. The Sortino ratio is calculated as follows: The risk-free rate is the return of an investment…
-
What is the Sharpe Ratio
The Sharpe ratio is a measure of the risk-adjusted return of an investment. It is calculated by dividing the excess return of an investment over a risk-free asset by the standard deviation of the investment’s returns. The excess return is the return of the investment minus the return of the risk-free asset. The standard deviation…
-
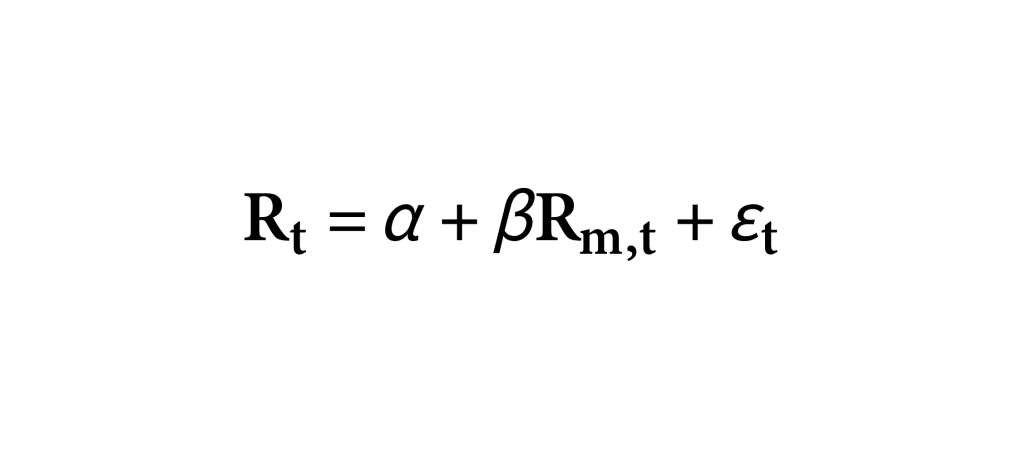
How to calculate the alpha (α) & beta (β) of an investment portfolio on Google Sheets™
In our previous blog post, we delved into the world of alpha and its significance in investment analysis. Today, we’re taking it further: by exploring how to calculate two key performance metrics, alpha (α) and beta (β), for your investment portfolio right within Google Sheets™. But first, let’s quickly recap what alpha and beta represent.…
-
Understanding Alpha in Investment Analysis
Alpha is a crucial metric in the world of finance that measures excess returns and provides insights into how well a manager or investment has performed compared to a benchmark. It is a key indicator of whether a manager is outperforming or underperforming passive investment strategies with similar market exposures. Alpha, represented as α, provides…
-
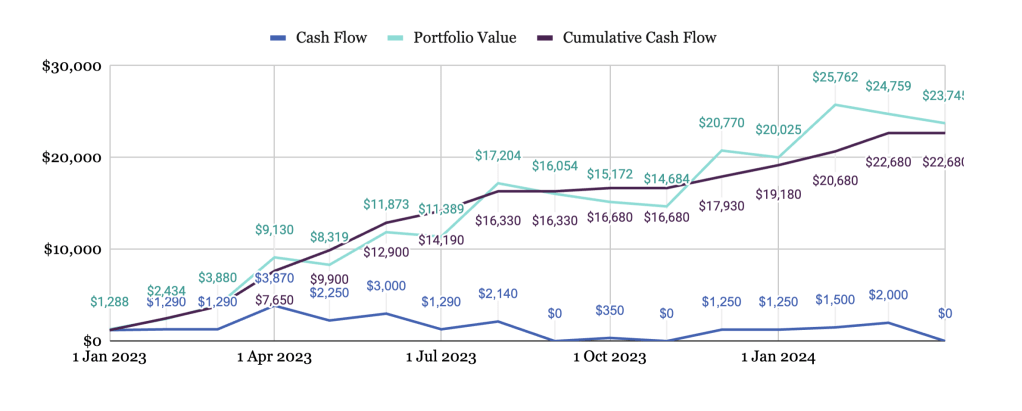
Mastering Investment Evaluation: A Guide to Calculating IRR and XIRR with Google Sheets™
When it comes to evaluating the performance of your investments, two critical metrics that can help you make informed decisions are Internal Rate of Return (IRR) and Extended Internal Rate of Return (XIRR). These metrics provide insights into the profitability and efficiency of your investments over time, considering cash flows at different periods. In this…
Subscribe
Enter your email below to receive updates.