-
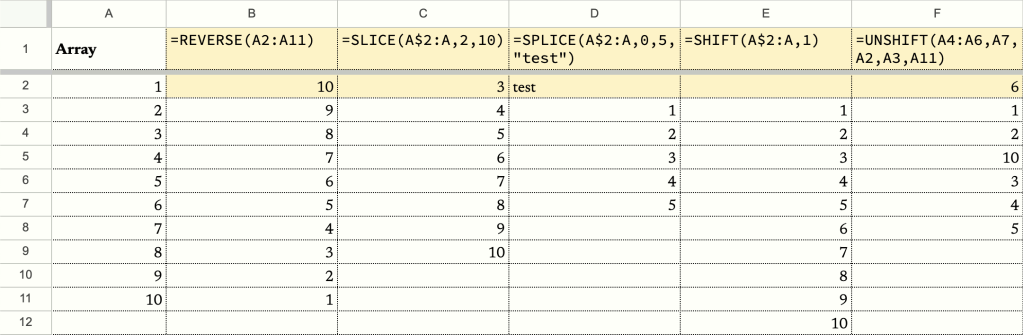
If you’ve spent hours tinkering with Google Sheets, you’ve probably encountered the frustration of wanting to remove the header from an array, only to discover that there’s no built-in formula for that. How frustrating! But luckily, Google Sheet lets us create our own formulas. There’re two ways to do so. The first one is through…
-
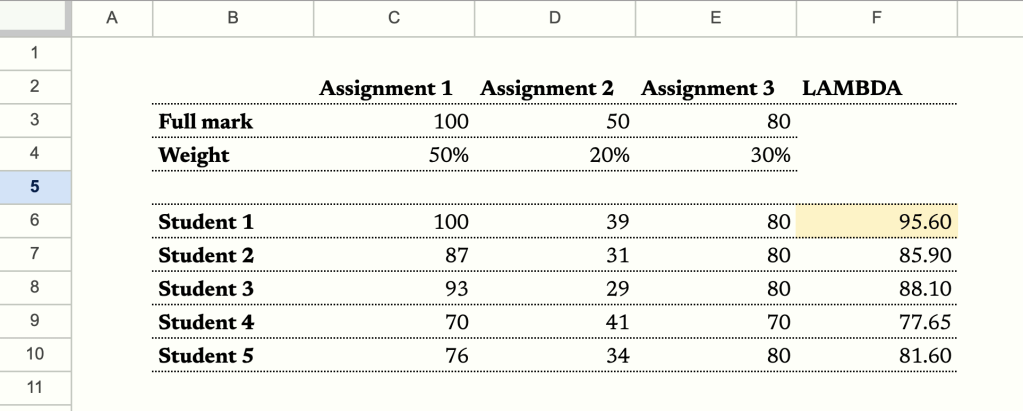
In this post I’m going to diverge from the usual topic of finance and focus on a powerful feature of the Google Sheets, named functions. I’m going to demonstrate how to create a named function to boost your productivity and use it in conjunction with LAMBDA functions. When I was working as a teacher, I…
-
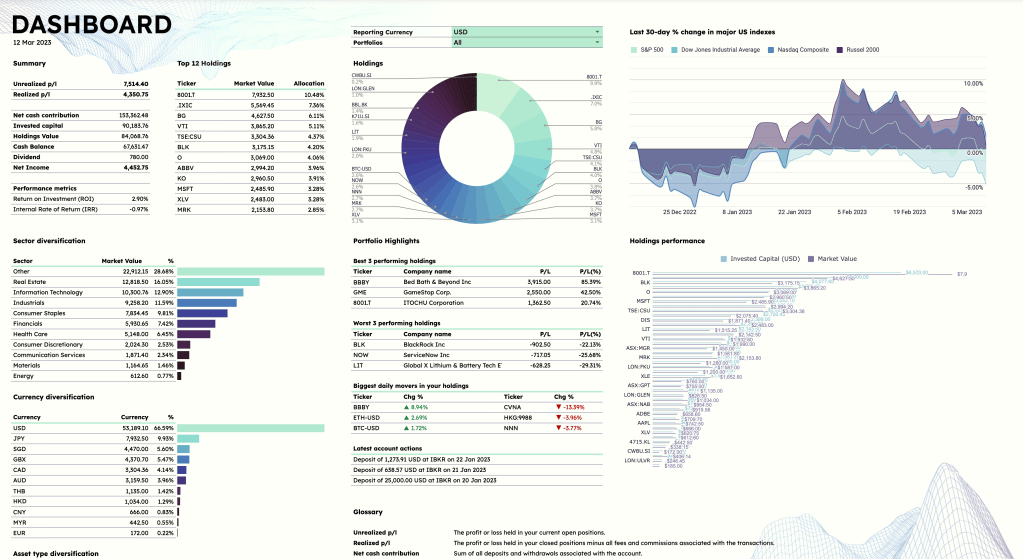
In the vast realm of stock portfolio trackers, I embarked on a quest to find the perfect balance between functionality and aesthetics. Spoiler alert: my search was as fruitful as finding a unicorn in the stock market. So, I rolled up my sleeves and took matters into my own hands, crafting a stock portfolio tracker…
-

To recap, here is how the mock portfolio looks like currently (23 Dec 2022). Considering more positions are added to the portfolio, it would be helpful if we can have an overview of the relative size of each position in the form of a pie chart. This can inform our investment decisions going forward. Using…
-

We’ll now get to the columns that we’ve left blank from our previous tutorial. First, let’s select cell B2, then in the menu above, go to “Data” > “Data validation”. Under “Criteria”, select “List of items”, and type “Open,Close” in the box next to it. This creates a dropdown menu in cell B2 consisting of…
-
Intro This will be a series showing you each step in developing a portfolio tracker on Google Sheet. We’ll start by building a tracker that tracks the p/l of your current stock positions and the p/l of your closed positions. As the project progresses, we’ll develop more advanced functions, some of which you can see…
-
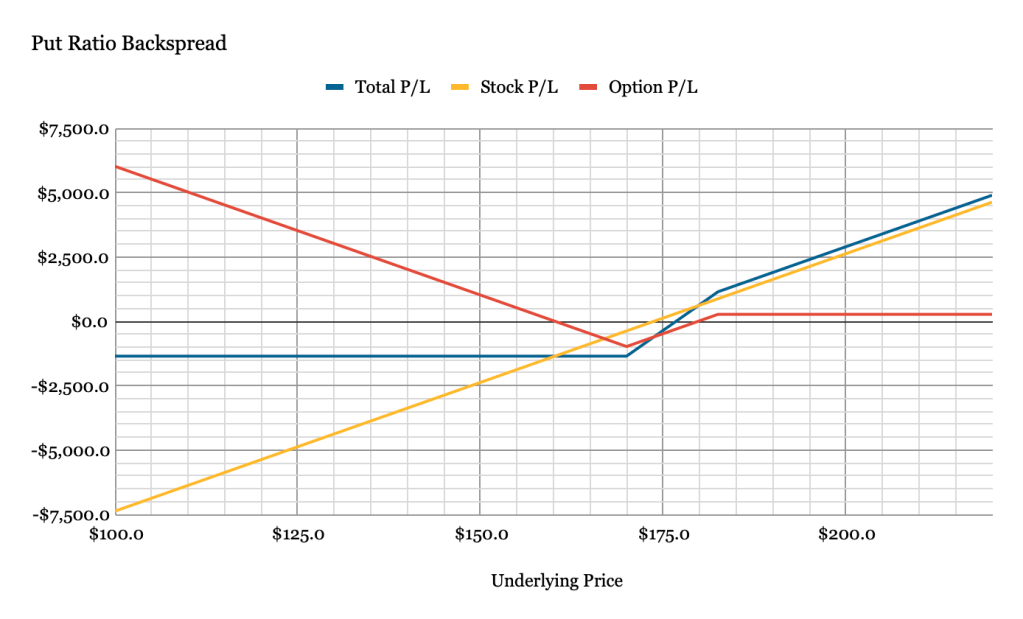
The prospects of selling Covered Calls are attractive to investors as the strategy can be used to generate extra income in the form of option premiums when an option is out-of-the-money at expiration. However, it is important to note that this strategy does not provide much downside protection. In a case of a precipitous drop…
-
Subscribe
Subscribed
Already have a WordPress.com account? Log in now.
